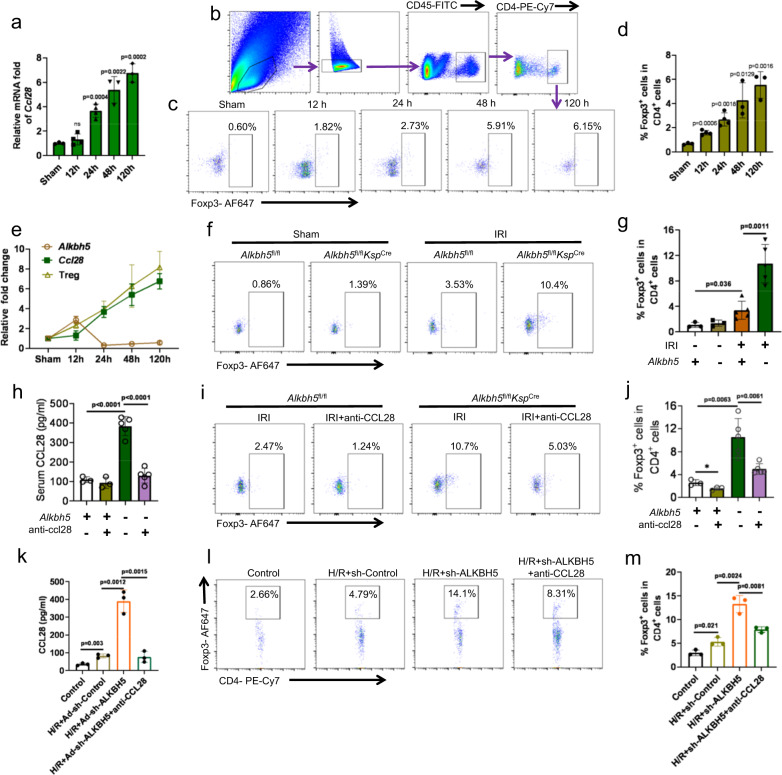
Fig. 6. Alkbh5 deficiency increased the recruitment of Tregs through CCL28.
a RNA level of Ccl28 in different times after I/R was examined by RT-qPCR. n = 3, 4, 4, 3, 3 biologically independent animals for Sham, 12 h, 24 h, 48 h, and 120 h groups, respectively. b The FACS analysis process of Tregs. c, d Representative flow cytometry dot plots and percentage of CD4+Foxp3+ cells among the CD4+ T cells at 0 h, 12 h, 24 h, 48 h, and 120 h after I/R. n = 3, 4, 4, 3, 3 biologically independent animals for Sham, 12 h, 24 h, 48 h, and 120 h groups, respectively. e The line chart showed the relationship of ALKBH5, CCL28, and Tregs. f, g Renal recruitment of CD4+Foxp3+ cells 24 h after IRI in 4 groups. n = 3 for Sham groups, n = 5 for IRI groups. Each data point represents one animal. h The CCL28 protein in serum from IRI-Alkbh5fl/flKspCre or IRI-Alkbh5fl/fl mice with or without CCL28 antibody treatment. i, j Representative flow cytometry dot plots and percentage of CD4+Foxp3+ cells among the CD4+ T cells in IRI-Alkbh5fl/flKspCre or IRI-Alkbh5fl/fl mice with or without CCL28 antibody treatment. n = 3 for IRI-Alkbh5fl/fl groups, n = 5 for Alkbh5fl/flKspCre groups. Each data point represents one animal. k CCL28 protein in supernatants from mRTECs cells incubated under hypoxic or oxic conditions with or without Ad-sh-ALKBH5 and CCL28 antibody treatment, as determined by ELISA. n = 3 biologically independent experiments. l, m Representative flow cytometry dot plots and percentage of recruited CD4+Foxp3+ cells among the CD4+ T cells in groups with or without hypoxic, Ad-sh-ALKBH5, and CCL28 antibody treatment. n = 3 biologically independent experiments. Data are shown as means ± SD. Unpaired two-tailed Student’s t-test for (a), (d), (e), (g), (h), (j), (k), and (m).

