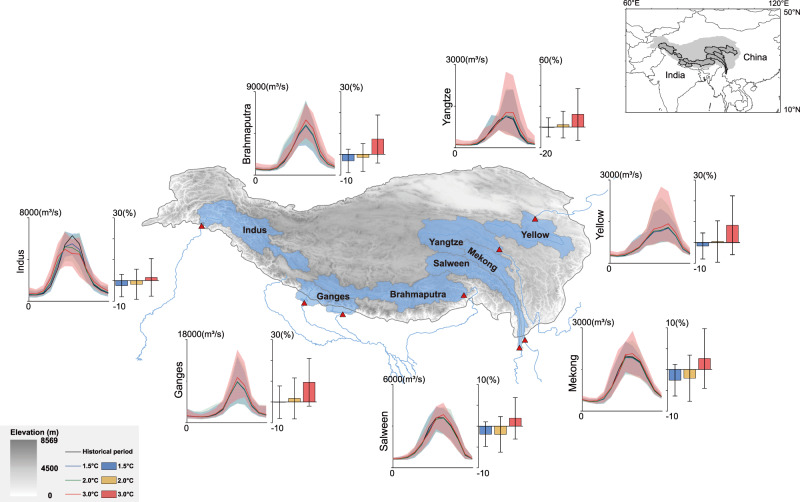
Fig. 1. Relative changes of river flows at the warming levels of 1.5 °C, 2.0 °C, and 3.0 °C for the seven rivers.
Color bars represent the ensemble mean from the hydrological simulations driven by the output from 22 CMIP6 models, while error bars represent one standard deviation. Solid lines represent the ensemble mean, while shadings show the range. Red triangles show basin outlets. Gray shading represents elevation (in meters), while the blue shading shows the basin boundary. The Tibetan Plateau boundary is defined by the elevation contour of 2500 m65.

