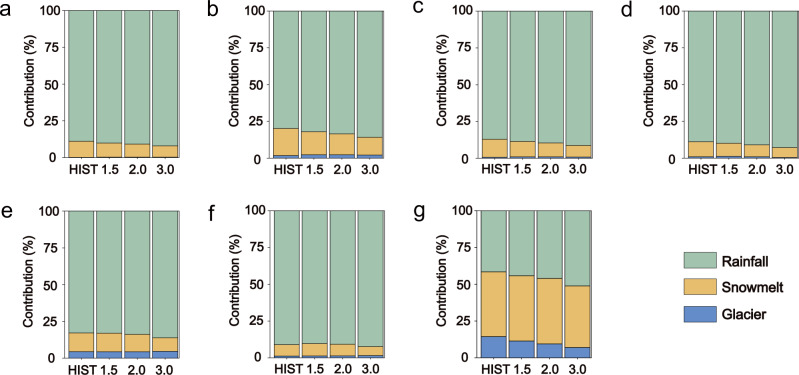
Fig. 2. Relative contribution of different runoff components to total runoff at the warming levels of 1.5 °C, 2.0 °C, and 3.0 °C for the seven basins.
a Yellow; b Yangtze; c Mekong; d Salween; e Brahmaputra; f Ganges; g Indus. The first column shows the contribution during the historical period (1985–2014, HIST), while the second to the fourth columns show the contribution at the global warming level of 1.5 °C, 2.0 °C, and 3.0 °C, respectively.

