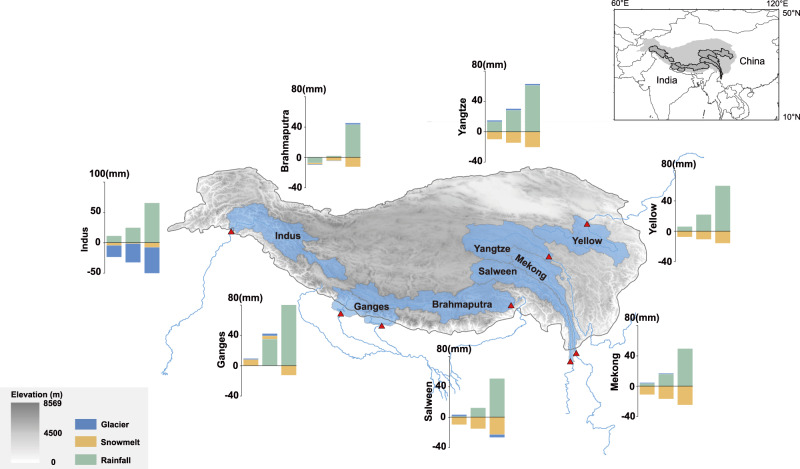
Fig. 3. Relative changes in annual mean rainfall runoff, snowmelt runoff, and glacier runoff at the warming levels of 1.5 °C, 2.0 °C, and 3.0 °C for the seven basins.
The first to third bars show the changes at the warming level of 1.5 °C, 2.0 °C, and 3.0 °C, respectively. Red triangles show basin outlets. Gray shading represents elevation (in meters), while the blue shading shows the basin boundary. The Tibetan Plateau boundary is defined by the elevation contour of 2500 m65.

