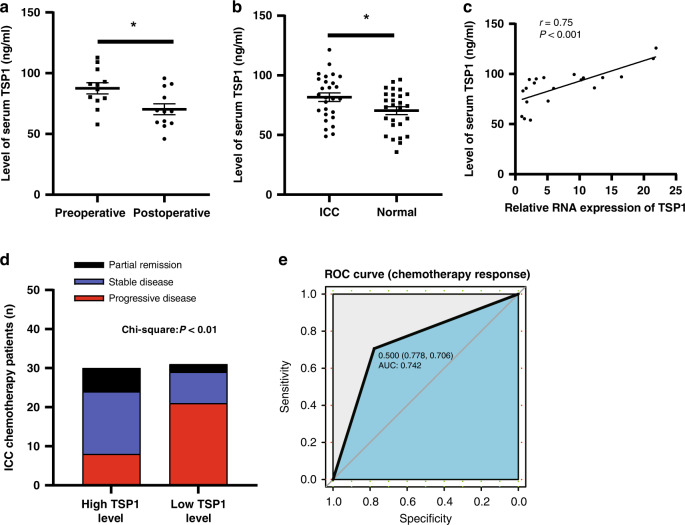
Fig. 3. High serum TSP1 levels correlate with better efficacy of gemcitabine-based chemotherapy for ICC.
a The difference in TSP1 expression between preoperative (n = 12) and postoperative ICC patients (n = 12). bThe expression level of serum TSP1 in ICC patients (n = 27) and healthy people (n = 27). c Correlation analysis of TSP1 expression levels in ICC patient tissues and serum (n = 20). * Represents P < 0.05. d Chemotherapy response of theTSP1 high expression group (n = 30) and low expression group (n = 31). PD represents disease progression, SD represents disease stability, PR represents disease remission. e The ROC curve between TSP1 and chemotherapy response.

