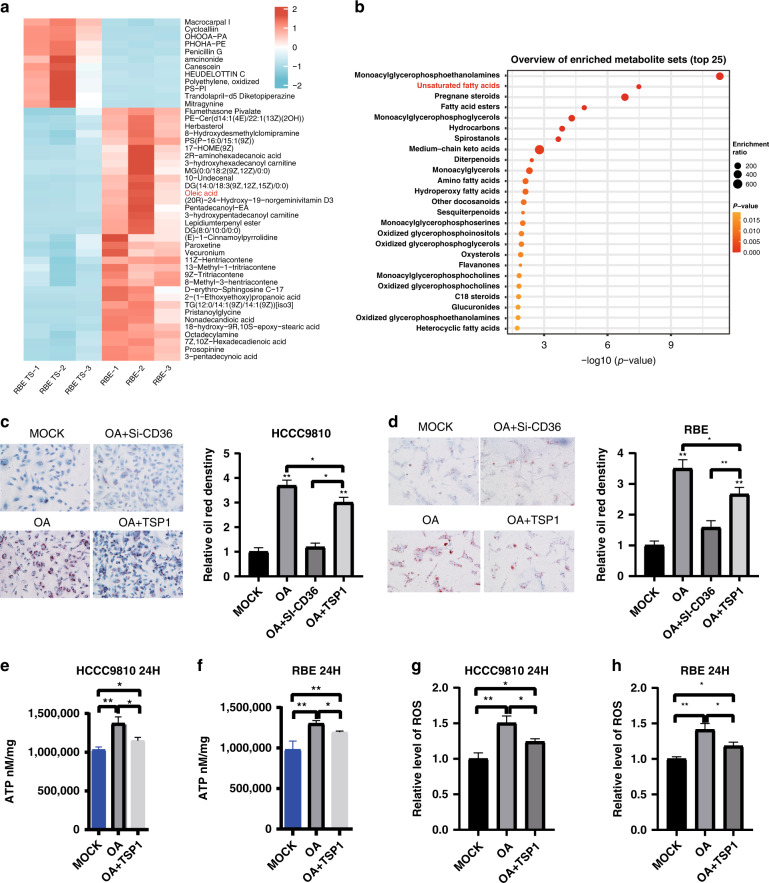
Fig. 6. TSP1 inhibits the uptake of oleic acid by intrahepatic cholangiocarcinoma cells, thereby increasing the therapeutic effect of gemcitabine.
a The LC-MS metabolomics differential metabolite map. b Enrichment analysis of differential metabolites. c The results of oil red O staining in different groups of HCCC9810 cells. d The results of oil red O staining in different groups of RBE cells. e ATP detection in HCCC9810 cells at 24 h. f ATP detection in RBE cells at 24 h. g Detection of ROS at 24 h in HCCC9810 cells. h Detection of ROS at 24 h in RBE cells. Data are shown as mean ± s.d. of n = 3 independent experiments (c–h). MOCK is the blank control, OA is oleic acid, OA + TSP1 is oleic acid + TSP1 recombinant protein, GEM is gemcitabine, OA + GEM is oleic acid + gemcitabine * represents p < 0.05, * * represents p < 0.01, * * represents p < 0.001.

