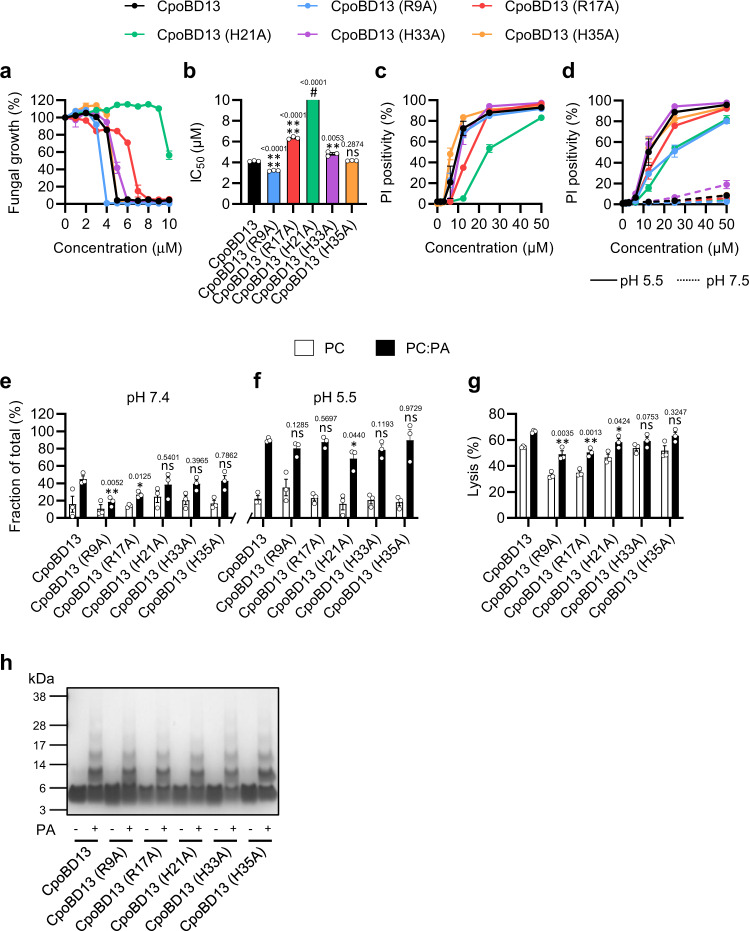
Fig. 4. Structure–function analysis of the interaction between CpoBD13 and PA.
Data represent ± SEM, n = 3. All statistical evaluations are comparisons to the corresponding CpoBD13 wild type sample. ns, not significant, *P < 0.05, **P < 0.01, ****P < 0.0001 two-tailed unpaired t test. Exact P values are stated above their respective graphs. a Fungal growth inhibition of C. albicans treated with wild type or mutant CpoBD13 over 24 h. b Calculated IC50 values of the fungal growth curves. # The IC50 of CpoBD13 (H21A) could not be determined within the assessed concentration range (0–10 µM). c Membrane permeabilisation of C. albicans treated with wild type or mutant CpoBD13 for 30 min as determined by the uptake of PI. d Membrane permeabilisation of C. albicans in pH buffered conditions (pH 5.5 = solid line, pH 7.5 = dashed line) treated with wild type or mutant CpoBD13 for 30 min. e Liposome pulldown quantification of the bound fractions of PC only (white) and 95:5 molar ratio PC:PA (black) liposomes incubated with 1 µg of CpoBD13 or its mutants performed at pH 7.4 and f again at pH 5.5. g Liposome lysis of calcein-encapsulated PC only and PC:PA liposomes by 20 µM wild type or mutant CpoBD13 over 30 min. Lysis was calculated as a fraction of a 100% lysis control using 0.1% Triton X-100. h Biochemical crosslinking of wild type or mutant CpoBD13 using BS(PEG)5 in the presence of PA followed by SDS-PAGE analysis and colloidal Coomassie staining. Image is representative of three independent experiments. (a–h) Source data are provided as a Source Data file.

