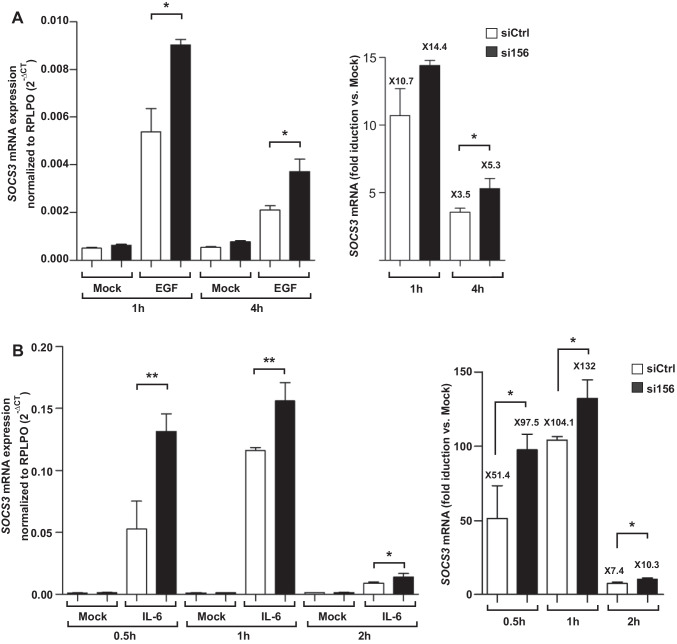
Fig. 8.
Enhanced activation of SOCS3 mRNA in PKM2 knockdown keratinocytes. A The expression of SOCS3 mRNA in EGF-stimulated HaCaTs was assessed by RT-PCR (left), and the fold induction of enhanced expression of SOCS3 in PKM2 knockdown cells as compared to stimulation of control siRNA transfected cells was evaluated by the 2−ΔΔCt method (right). Bars indicate means ± SD obtained from three independent experiments (n = 3) performed in triplicate; *P < 0.05 (unpaired Student’s t-test). B The expression of SOCS3 mRNA upon stimulation with IL-6 (20 ng/ml) was quantified by RT-PCR (left). IL-6 stimulation of SOCS3 mRNA expression is markedly increased upon targeting PKM2 expression as compared to stimulation of control siRNA transfected cells (right). Bars indicate means ± SD obtained from three independent experiments (n = 3) performed in triplicate; **P < 0.01 and *P < 0.05 (one-way ANOVA) (Bonferroni’s post-hoc test). The fold of stimulation in A and B is indicated on top of the bars (A and B)

