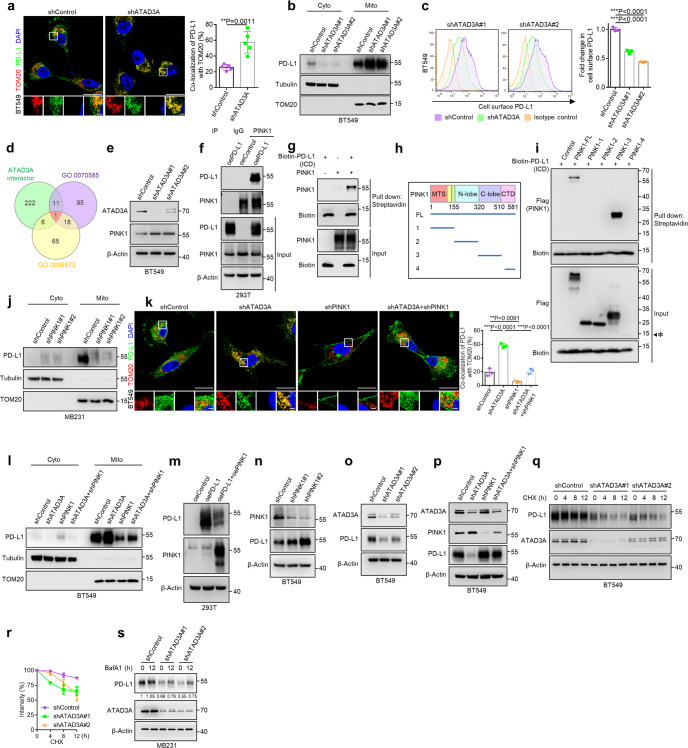
Fig. 3. Involvement of ATAD3A-PINK1 mitophagy in the distribution and degradation of PD-L1.
a Left, immunostaining of PD-L1 (green) and TOM20-labeled mitochondria (red) in BT549 human TNBC cells with or without ATAD3A-knockdown (shATAD3A#1 and shATAD3A#2). Scale bars, 20 μm and 2 μm (inset). Right, the percentage of PD-L1 co-localized with TOM20 (n = 5 fields, t-test). b Immunoblot of PD-L1 in the cytoplasm and mitochondria of control and ATAD3A-knockdown BT549 cells. TOM20 and Tubulin were used as mitochondria and cytoplasm protein controls, respectively. Cyto, cytoplasm; mito, mitochondria. c Flow cytometry (left) and quantification (right) of surface PD-L1 in control and ATAD3A-knockdown BT549 cells (n = 3, one-way ANOVA). d Venn diagram depicting overlapped genes for the interaction protein of ATAD3A set (BioGRID, RP5-832C2.1), the protein localization to mitochondrion set (GOBP 0070585) and the intrinsic component of mitochondrial membrane (GOCC 0098573). e Immunoblot of PINK1 in control and ATAD3A-knockdown BT549 cells. f Immunoblot of PD-L1 and PINK1 in HEK293T cells overexpressing PD-L1 (OE-PD-L1) and control cells (OE-Control), assessed after immunoprecipitation with immunoglobulin G (IgG) or antibody to PINK1. g Protein direct interaction analysis of the intracellular domain of PD-L1 (ICD) and PINK1 in vitro. Purified Flag-labeled full-length PINK1 was incubated with Biotin-labeled PD-L1 ICD domain, followed by streptavidin pull-down and immunoblot. h Schematic diagram of Flag-labeled full-length (FL) and truncated mutants with indicated domains (amino acids 1–155, amino acids 156–320, amino acids 321–509, amino acids 510–581) of PINK1. MTS, mitochondrial targeting sequence; N-lobe, kinase domain N; C-lobe, kinase domain C; CTD, C-terminal domain. i Protein direct interaction analysis of the intracellular domain of PD-L1 (ICD) and truncated PINK1 mutants in vitro. Purified Flag-labeled full-length and truncated PINK1 were incubated with Biotin-labeled PD-L1 ICD domain, followed by streptavidin pull-down and immunoblot. The estimated size of PINK1-4 (amino acids 510–581) which did not express in HEK293T cells was labeled with asterisk. j Immunoblot of PD-L1 in the cytoplasm and mitochondria of MDA-MB-231 cells with or without PINK1-knockdown (shPINK1#1 and shPINK1#2). TOM20 and Tubulin were used as mitochondria and cytoplasm protein controls. Cyto, cytoplasm; mito, mitochondria. k Left, co-localization of PD-L1 (green) and TOM20 (red) in control, ATAD3A knockdown, PINK1 knockdown or ATAD3A and PINK1 double knockdown BT549 cells. Scale bars, 20 μm and 2 μm (inset). Right, the percentage of PD-L1 co-localized with TOM20 (n = 5 fields, one-way ANOVA). l Immunoblot of PD-L1 in the cytoplasm and mitochondria of control, ATAD3A-knockdown, PINK1-knockdown or ATAD3A and PINK1 double knockdown BT549 cells. m Immunoblot of indicated proteins in PD-L1-transfected HEK293T cells with or without PINK1 overexpression. n Immunoblot of PD-L1 in control and PINK1-knockdown (shPINK1#1 and shPINK1#2) BT549 cells. o Immunoblot of PD-L1 in BT549 cells transfected with control shRNA or shATAD3A (shATAD3A#1 and shATAD3A#2). p Immunoblot of total PD-L1 in control, ATAD3A-knockdown, PINK1-knockdown or ATAD3A and PINK1 double knockdown BT549 cells. q Immunoblot of PD-L1 in control and ATAD3A-knockdown BT549 cells treated with 20 μM CHX for indicated times. h, hours. r Quantification of PD-L1 intensity in immunoblot in control and ATAD3A-knockdown BT549 cells. s Immunoblot of PD-L1 in control and ATAD3A-knockdown MDA-MB-231 cells incubated with 20 nM BafA1 for indicated times. h, hours. Data are representative of at least two independent experiments and are shown as means ± SD. See also Supplementary information, Figs. S3 and S4.

