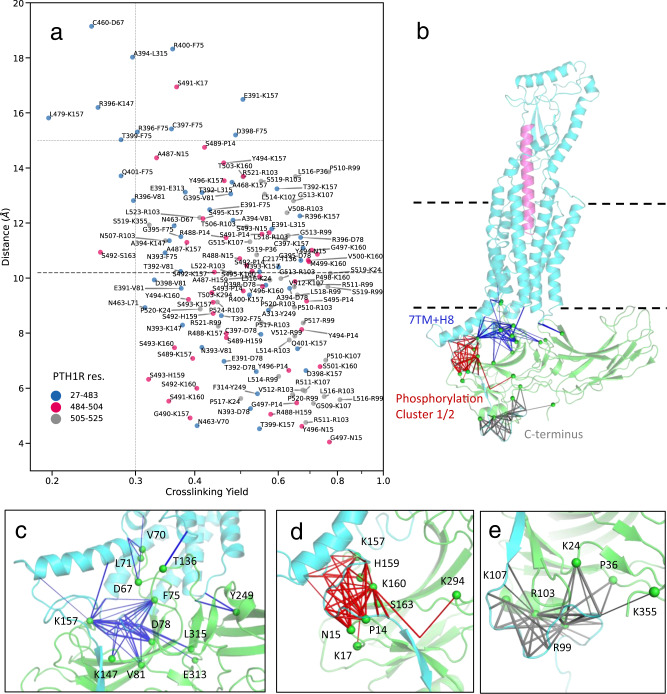
Fig. 3. Crosslinking-guided model of PTHLA-PTH1R-arr2 complex.
a Plot of pairwise Cβ-Cβ distances against chemical crosslinking yields in the PTH1R-arr2 model after flexible refinement from the M2R-arr2 template. For glycine, Cα was used instead of Cβ. The horizontal dashed line at 10.2 Å marks the estimated distance (Cβ-Cβ) for BrEtY-Cys crosslinking, whereas the dotted line at 15.0 Å represents the maximal crosslinking distance when taking into account the flexibility of the complex. The large majority of the crosslinking pairs (125 out of 136), lie within 15.0 Å in the static 3D model, suggesting overall agreement with the crosslinking data. Source data are provided in Supplementary Data 3. b Overview of the complex with the location of the crosslinking pairs is shown. Crosslinking pairs in the 7TM and helix VIII of PTH1R (blue, c), in the proximal and distal phosphorylation clusters (red, d) and in the end of truncated C-terminus (gray, e) are shown as connecting solid lines in separate panels; the thickness of each line represents crosslinking yield; residues of arr2 are labeled. For illustrative purposes, a sphere is placed on Cα of labeled arr2 residues instead of the Cβ where the distances are measured.

