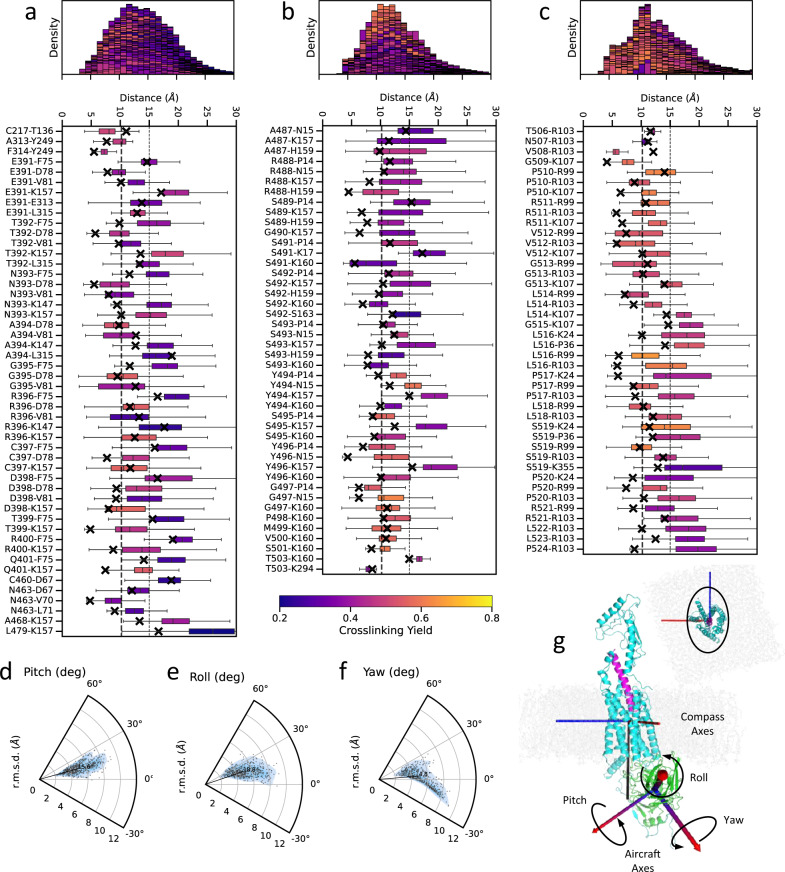
Fig. 5. Dynamics of the assembled complex based on M2R-arr2 template.
a–c Box plots and stacked histograms showing statistics of crosslinking distances in MD simulations in PTH1R-arr2. Pairwise Cβ-Cβ distances were measured; when glycine was present, Cα was used instead. Chemical crosslinking pairs are grouped by PTH1R regions, namely (a) 7TM + helix VIII (res. D27–F483), (b) proximal and distal phosphorylation clusters (res. K484–S504), and (c) the rest of the C-terminus in this construct (res. V505–T525). The whiskers of the box plot indicate the maximum and minimum of the distance observed; the center of the box indicates median value of the distance observed; the lower and upper bounds of the box indicates the 25th percentile and the 75th percentile of the distance observed. These descriptive statistics were collected with n = 12,000 frames from the ten 1200 ns trajectories. Distances in the starting model are marked with crosses. The lower bound of the covalent diameter at 10.2 Å of BrEtY is drawn as a thick vertical dash line accompanied by a thin dash line at 15 Å. Both plots are colored by the crosslinking yield of individual pairs. The stacked histograms on top give an overall summarizing statistics of the Cβ-Cβ distances in each of the PTH1R regions showing that the vast majority of pairs stays within 15 Å distance during MD simulations. The orientation of arr2 relative to PTH1R was measured in terms of pitch, roll, and yaw angles of rotation around their principal axes. Source data for Fig. 5a–c are provided as Supplementary Data 4–6. d–f Distribution of pitch, roll, yaw angles and r.m.s.d. of arr2 from its starting coordinates for each frame in MD simulations. In general, the orientations are limited by the membrane anchoring of C-edge with pitch angle showing a modest ~13 degrees deviation, followed by ~17 degrees of roll and up to 25 degrees of yaw deviations. (g) Compass and aircraft axes to define pitch, roll, yaw angles. Source data for Fig. 5d–f are provided as Supplementary Data 7.

