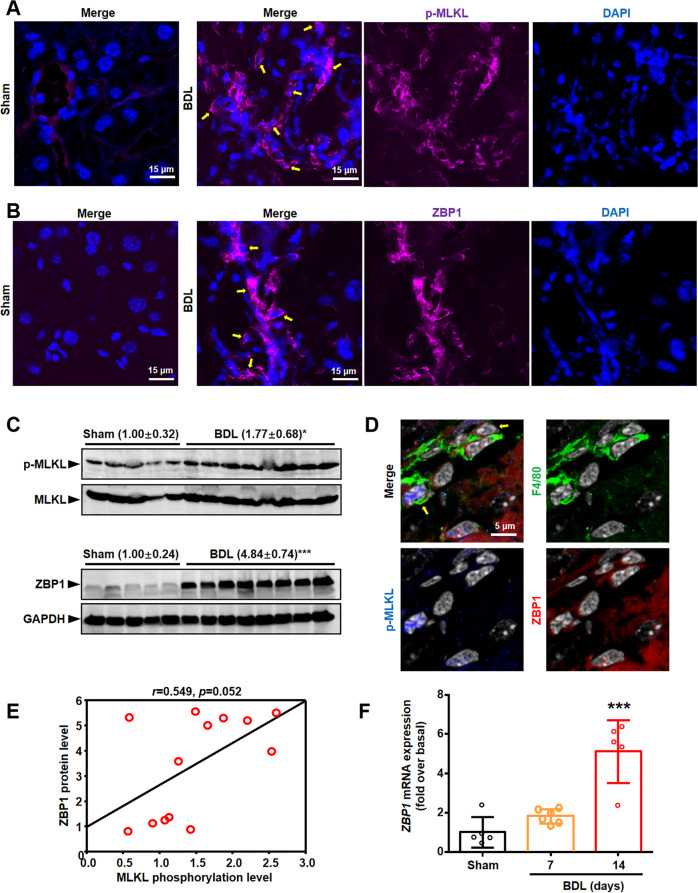
Fig. 3. Necroptosis existed in BDL livers.
A Representative images of p-MLKL (pink) staining. The nuclei were stained with DAPI (blue). Yellow arrows: p-MLKL+ cells. Scale bar: 15 μm. B Representative images of ZBP1 (pink) staining. The nuclei were stained with DAPI (blue). Yellow arrows: ZBP1+ cells. Scale bar: 15 μm. C Western blot analysis for p-MLKL and ZBP1 in the liver tissues from BDL (n = 8) and Sham mice (n = 5). Bolts of p-MLKL were normalized to MLKL. Blots of ZBP1 were normalized to GAPDH. D Representative images of F4/80 (green), ZBP1 (red) and p-MLKL (blue) staining in BDL livers. The nuclei were stained with DAPI (white). Yellow arrows: p-MLKL+ZBP1+F4/80+ cells. E The correlation between ZBP1 and p-MLKL levels in mice liver tissues. F mRNA level of Zbp1 in mice livers was measured by qRT-PCR. Data are presented as the mean ± SEM. *p < 0.05, ***p < 0.001 (versus control).

