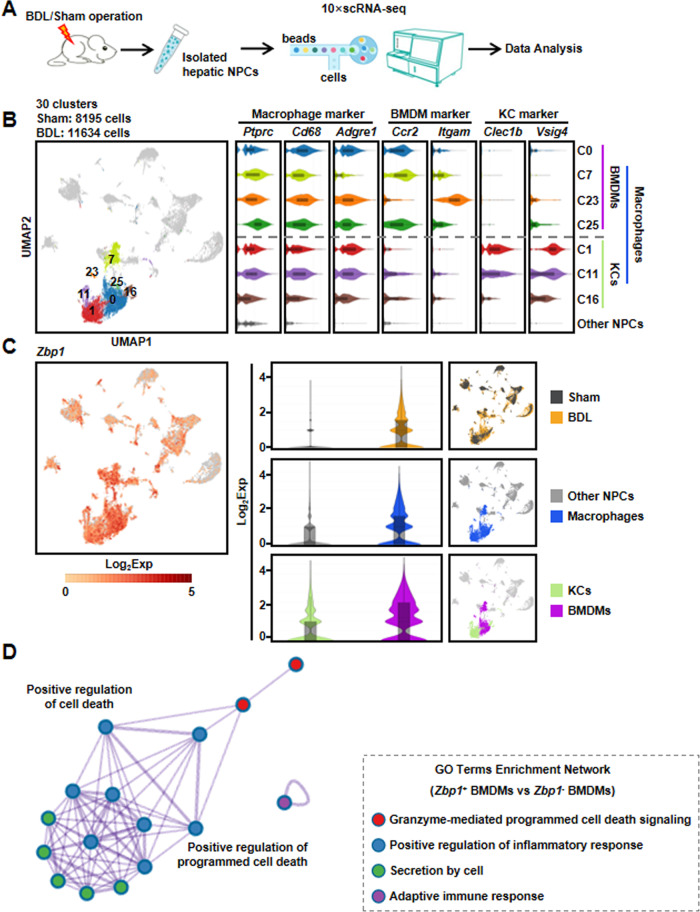
Fig. 5. scRNA-seq analysis showed that Zbp1 was dominantly and highly expressed in BMDMs after BDL injury.
A Schematic diagram of the experimental design for scRNA-seq. B Uniform manifold approximation and projection (UMAP) plot depicted 19,829 cells representing NPC clusters (left panel). Violin plots showed marker gene expressions across macrophage, bone marrow derived macrophage (BMDM), and Kupffer cell (KC) clusters (right panel). C Violin plots showed the expression of Zbp1 in each cell clusters. D Gene Ontology (GO) analysis was performed based on the differential expressed genes between ZBP1+ and ZBP1− BMDMs in scRNA-seq.

