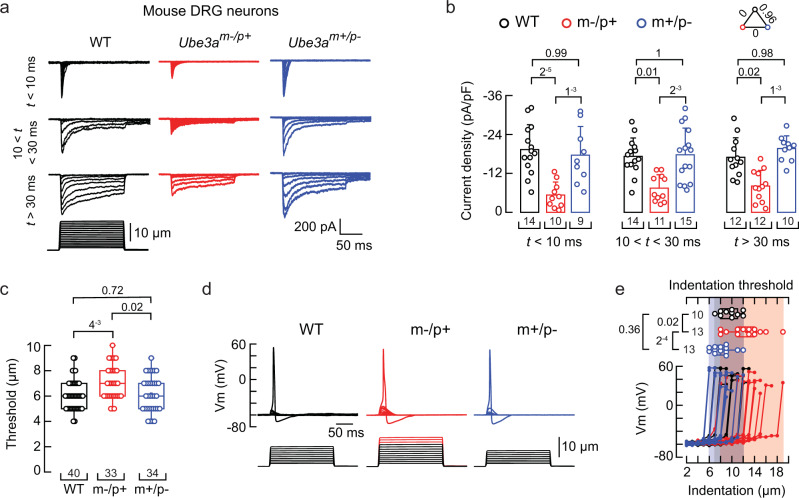
Fig. 1. Ube3am–/p+ DRG neurons display reduced mechano-currents and -excitability.
a Representative whole-cell patch-clamp recording elicited by mechanical stimulation (−60 mV) of rapidly, intermediate, and slowly inactivating currents of WT, Ube3am–/p+, and Ube3am+/p– DRG neurons. b Current densities elicited by maximum displacement of DRG neurons classified by their time constant of inactivation. Bars are mean ± SD. Two-way ANOVA (F = 35.44, p = 2.63−12) and Tukey multiple-comparisons test. c Boxplots show the displacement thresholds required to elicit mechanocurrents of DRG neurons. Boxplots show mean (square), median (bisecting line), bounds of box (75th to 25th percentiles), outlier range with 1.5 coefficient (whiskers), and minimum and maximum data points. Kruskal-Wallis (H = 9.51; p = 0.0086) and Dunn’s multiple comparisons test. d Representative current-clamp recordings of membrane potential changes elicited by mechanical stimulation in DRG neurons. e Membrane potential peak vs. mechanical indentation of independent mouse DRG neurons. At the top, boxplots show the displacement threshold required to elicit an action potential in these neurons. Boxplots show mean (square), median (bisecting line), bounds of box (75th to 25th percentiles), outlier range with 1.5 coefficient (whiskers), and minimum and maximum data points. One-way ANOVA (F = 10.54; p = 2.89−4) and Tukey multiple-comparisons test. n is denoted in each panel. Post hoc p values are denoted in the corresponding panels. Source data are provided as a Source Data file.

