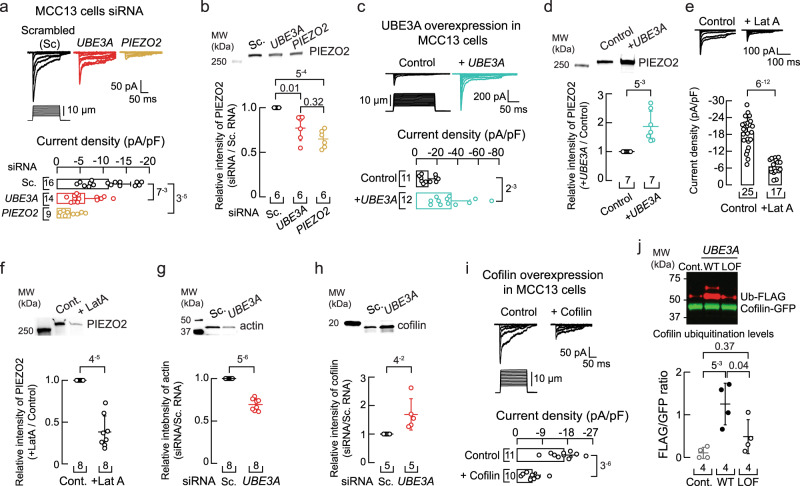
Fig. 2. UBE3A knockdown increases cofilin and decreases F-actin content and PIEZO2 function.
a Top, representative whole-cell patch-clamp recordings of currents elicited by mechanical stimulation (−60 mV) in MCC13 cells transfected with scrambled, UBE3A, or PIEZO2 siRNAs. Bottom, current densities elicited by maximum displacement of siRNA-transfected cells. Bars are mean ± SD. Kruskal-Wallis (H = 18.76; p = 8.4−5) and Dunn’s multiple comparisons test. b Top, western blot (anti-PIEZO2) of the membrane fractions of MCC13 cells transfected as in (a). Bottom, mean/scatter-dot plot showing relative intensities of PIEZO2 protein normalized to PIEZO2 in the Sc. group. Lines are mean ± SD. Kruskal-Wallis (H = 12.78; p = 0.0017) and Dunn’s multiple comparisons test. c Top, currents elicited by mechanical stimulation (−60 mV) in cells transfected with UBE3A plasmid. Bottom, current densities elicited by maximum displacement of UBE3A transfected cells. Bars are mean ± SD. Two-tailed unpaired t-test with Welch’s correction (t = 3.9). d Top, western blot (anti-PIEZO2) of the membrane fractions of MCC13 cells transfected with UBE3A plasmid. Bottom, mean/scatter-dot plot showing relative intensities of PIEZO2 protein in UBE3A transfected cells normalized to PIEZO2 in the control group. Lines are mean ± SD. Two-tailed one-sample t-test (t = 4.4). e Top, currents elicited by mechanical stimulation (−60 mV) of latrunculin A (1 µM; 24 h)-treated MCC13 cells. Bottom, current densities elicited by maximum displacement. Bars are mean ± SD. Two-tailed unpaired t-test with Welch’s correction (t = 9.9). f Top, western blot (anti-PIEZO2) of the membrane fractions of MCC13 cells treated as in (e). Bottom, mean/scatter-dot plot showing relative intensities of PIEZO2 protein normalized to PIEZO2 in the control group. Lines are mean ± SD. Two-tailed one-sample t-test (t = −9.1). g Top, western blot (anti-actin) of the cytoskeletal fractions of MCC13 transfected with scrambled (Sc.) or UBE3A siRNAs. Bottom, mean/scatter-dot plot showing relative intensities of actin protein normalized to actin in the Sc. group. Lines are mean ± SD. Two-tailed one-sample t-test (t = −12.5). h Top, western blot (anti-cofilin) of the cytosolic fractions of MCC13 transfected as in (g). Bottom, mean/scatter-dot plot showing relative intensities of cofilin protein normalized to cofilin in the Sc. group. Lines are mean ± SD. Two-tailed one-sample t-test (t = 2.8). i Top, currents elicited by mechanical stimulation (−60 mV) in MCC13 cells transfected with cofilin plasmid. Bottom, current densities elicited by maximum displacement of cofilin transfected cells. Bars are mean ± SD. Two-tailed unpaired t-test with Welch’s correction (t = 6.8). j Top, western blot of pulldown GFP-tagged cofilin from HEK293T cells transfected with a control vector (Ctrl), wild-type UBE3A (WT), or a catalytically inactive UBE3A (LOF). The ubiquitinated (Ub) fraction (red) was monitored with an anti-FLAG antibody. Bottom, mean/scatter-dot plot showing Ub-FLAG/Cofilin-GFP ratios. Lines are mean ± SD. One-way ANOVA (F = 9.86; p = 0.0054) and Tukey multiple-comparisons test. n is denoted in each panel. Post hoc p-values are denoted in the corresponding panels. Source data are provided as a Source Data file.

