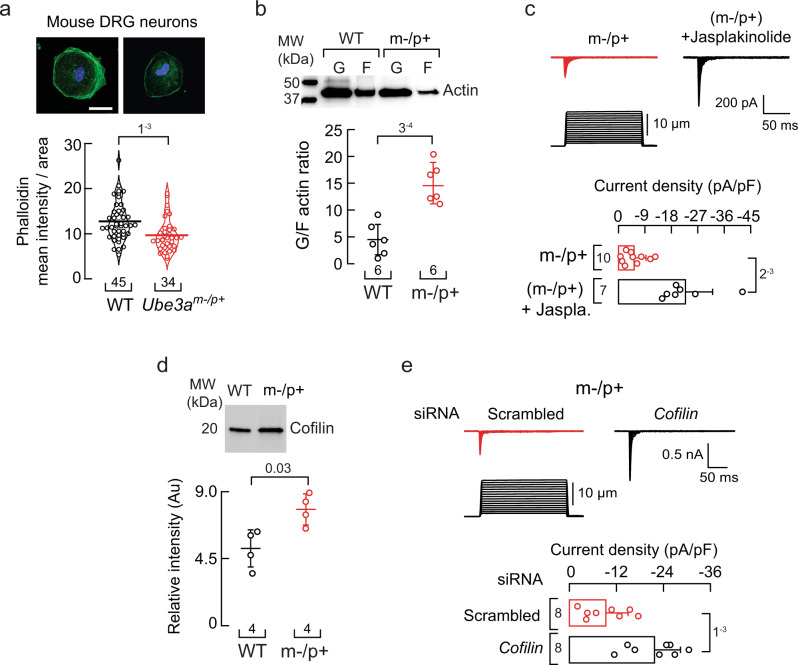
Fig. 3. Ube3am–/p+ DRG neurons display reduced F-actin and jasplakinolide treatment increases PIEZO2 currents.
a Top, representative micrographs of cultured WT and Ube3am–/p+ DRG neurons fixed and stained with phalloidin (green) and DAPI (blue). Scale bar 20 µm. Bottom, phalloidin mean intensity normalized by the neuron’s area is depicted as a violin plot with the means shown as horizontal bars. Two-tailed unpaired t-test (t = 3.41). b Top, western blot of soluble and insoluble actin (G and F, respectively) of WT and Ube3am–/p+ DRGs. Bottom, mean/scatter-dot plot showing G/F actin ratios. Lines are mean ± SD. Two-tailed unpaired t-test (t = 5.43). c Top, representative whole-cell patch-clamp recordings of PIEZO2 currents elicited by mechanical stimulation (−60 mV) of control and jasplakinolide (0.5 µM; 18 h)-treated Ube3am–/p+ DRG neurons. Bottom, current densities elicited by maximum displacement. Bars are mean ± SD. Two-tailed unpaired t-test with Welch’s correction (t = 4.68). d Top, representative western blot (anti-cofilin) of the cytosolic fractions of WT and Ube3am–/p+ DRGs. Bottom, mean/scatter-dot plot showing relative intensities of cofilin content. Lines are mean ± SD. Two-tailed Mann-Whitney test (U = 0). e Top, representative whole-cell patch-clamp recordings of currents elicited by mechanical stimulation (−60 mV) of Ube3am–/p+ DRG neurons transfected with scrambled or cofilin siRNAs. Bottom, current densities elicited by maximum displacement of siRNA-transfected Ube3am–/p+ DRGs. Bars are mean ± SD. Two-tailed unpaired t-test (t = 4.02). n is denoted in each panel. Post-hoc p-values are denoted in the corresponding panels. Source data are provided as a Source Data file.

