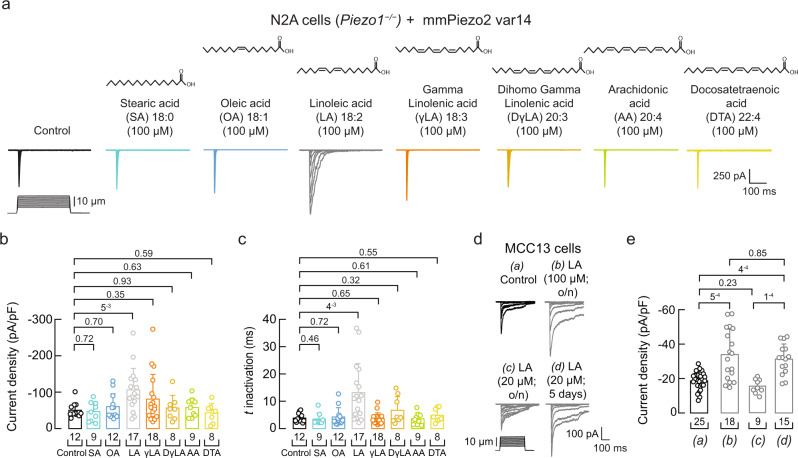
Fig. 4. LA increases PIEZO2 activity in Piezo1–/– N2A and MCC13 cells.
a Representative whole-cell patch-clamp recordings of currents elicited by mechanical stimulation (−60 mV) in control, SA, OA, LA, γLA, DγLA, AA, and DTA (100 µM; 24 h)-treated Piezo1–/– N2A cells transfected with Piezo2 variant 14 (var14). b Current densities elicited by maximum displacement of control or fatty acid-treated Piezo1–/– N2A cells transfected with Piezo2 var14. Bars are mean ± SD. Kruskal-Wallis (H = 15.7; p = 0.028) and Dunn’s multiple comparisons test. c Time constants of inactivation elicited by maximum displacement of control or fatty acid-treated Piezo1–/– N2A cells transfected with Piezo2 var14. Bars are mean ± SD. Kruskal-Wallis (H = 22.41; p = 0.0022) and Dunn’s multiple comparisons test. d Representative whole-cell patch-clamp recordings elicited by mechanical stimulation (−60 mV) of (a) control, (b) LA (100 µM; o/n), (c) LA (20 μM; o/n), and (d) LA (20 μM each day for five days)-treated MCC13 cells. e Current densities elicited by maximum displacement of control and LA-treated MCC13 cells. Bars are mean ± SD. Kruskal-Wallis (H = 27.03; p = 5.8−6) and Dunn’s multiple comparisons test. n is denoted in each panel. Post hoc p-values are denoted above the bars. Source data are provided as a Source Data file.

