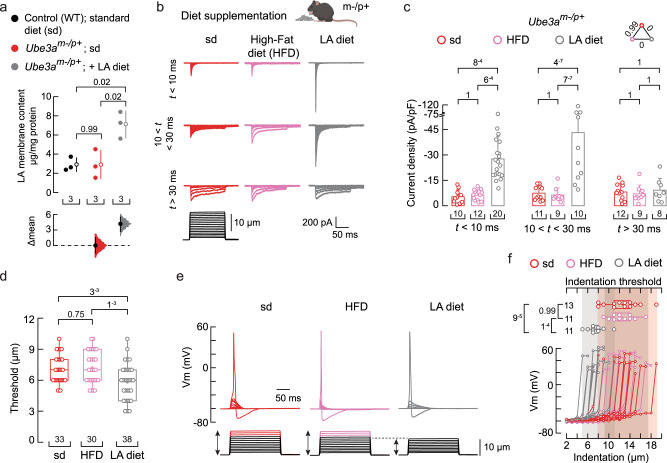
Fig. 7. A LA-enriched diet increases Ube3am–/p+ mouse mechano-currents and -excitability.
a Cumming estimation plot showing the mean differences in the LA membrane content of DRG neurons from WT, Ube3am–/p+, and Ube3am–/p+ mice fed with a LA-enriched diet, as determined by LC-MS. The raw data are plotted on the upper axes; each mean difference is plotted on the lower axes as a bootstrap sampling distribution. The mean differences are depicted as open circles; 95% confidence intervals are indicated by the ends of the vertical error bars. One-way ANOVA (F = 11.09; p = 0.0096) and Tukey multiple-comparisons test. b Representative whole-cell patch-clamp recordings elicited by mechanical stimulation (−60 mV) of rapidly, intermediate, and slowly-inactivating DRG neuron currents from Ube3am–/p+ mice fed with a standard (sd), high-fat (HFD), or LA-enriched (LA diet) diet. Top, mouse cartoon was created with BioRender.com. c Current densities elicited by maximum displacement of DRG neurons from Ube3am–/p+ mice fed with sd, HFD, or LA-enriched diets classified by their time constant of inactivation. Bars are mean ± SD. Two-way ANOVA (F = 25.36; p = 1.69−9) and Tukey multiple-comparisons test. d Boxplots show the displacement thresholds required to elicit DRG mechanocurrents from Ube3am–/p+ mice fed with sd, HFD, or LA-enriched diet. Kruskal-Wallis (H = 13.53; p = 0.0012) and Dunn’s multiple comparisons test. e Representative current-clamp recordings of membrane potential changes elicited by mechanical stimulation from DRG neurons of Ube3am–/p+ mice fed with sd, HFD, or LA-enriched diet. f Membrane potential peak vs. mechanical indentation of independent DRG neurons from Ube3am–/p+ mice fed with sd, HFD, or LA-enriched diet. At the top, boxplots show the displacement threshold required to elicit an action potential in these neurons. One-way ANOVA (F = 14.86; p = 2.72−5) and Tukey multiple-comparisons test. Boxplots show mean (square), median (bisecting line), bounds of box (75th to 25th percentiles), outlier range with 1.5 coefficient (whiskers), and minimum and maximum data points. n is denoted in each panel. Post-hoc p-values are denoted in the corresponding panels. Source data are provided as a Source Data file.

