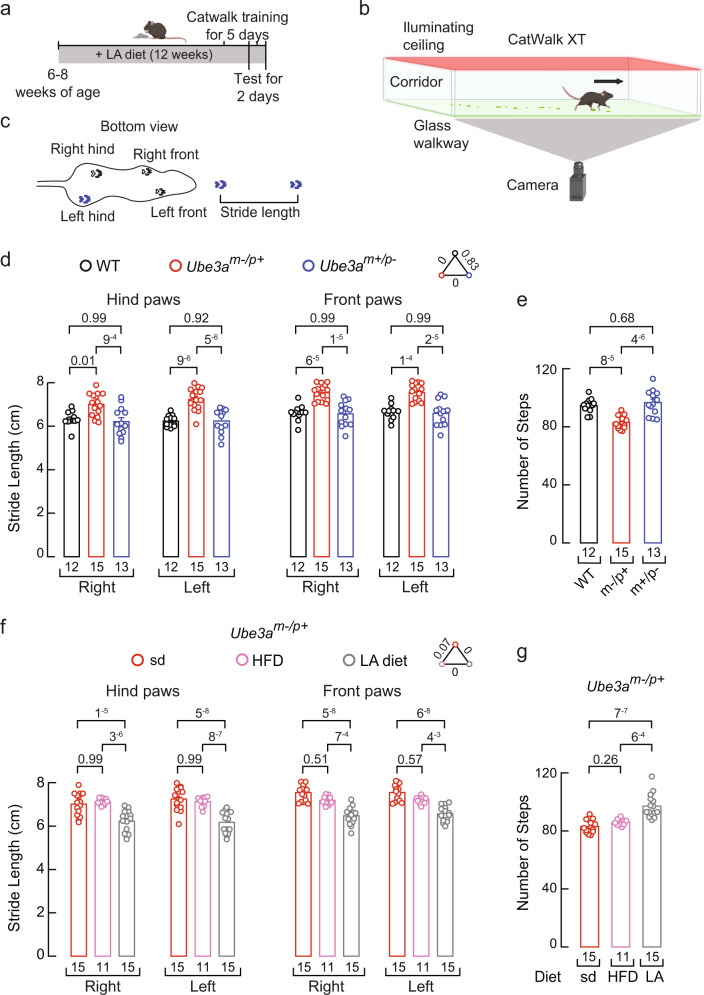
Fig. 8. A LA-enriched diet ameliorates gait ataxia in the Ube3am–/p+ mouse.
a Timeline depicting the experimental design for gait analyses. Top, mouse cartoon was created with BioRender.com. b Cartoon describing gait behavioral assay was created with BioRender.com. c Mouse silhouette depicting the distance defined as stride length. d Stride length from WT, Ube3am–/p+, and Ube3am+/p– mice fed with a standard diet. Bars are mean ± SEM. Two-way ANOVA (F = 70.2; p = 0) and Tukey multiple-comparisons test. e Number of steps from WT, Ube3am–/p+, and Ube3am+/p– mice fed with a standard diet. Bars are mean ± SEM. One-way ANOVA (F = 19.75; p = 1.46−6) and Tukey multiple-comparisons test. f Stride length from Ube3am–/p+ mice fed with a standard, high-fat diet, or LA-enriched diet. Bars are mean ± SEM. Two-way ANOVA (F = 100.9; p = 0) and Tukey multiple-comparisons test. g Number of steps from Ube3am–/p+ mice fed with a standard, high-fat diet, or LA-enriched diet. Bars are mean ± SEM. Kruskal-Wallis (H = 26.25; p = 1.9−6) and Dunn’s multiple comparisons test. n is denoted in each panel. Post-hoc p-values are denoted in the corresponding panels. Source data are provided as a Source Data file.

