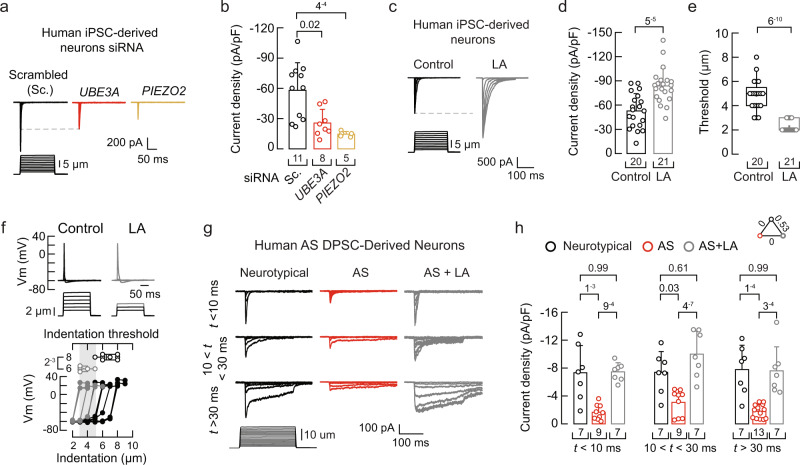
Fig. 9. Loss of UBE3A expression decreases PIEZO2 function in human-derived neurons.
a Representative whole-cell patch-clamp recordings of currents elicited by mechanical stimulation (−60 mV) in human iPSC-derived sensory neurons transfected with scrambled, UBE3A, or PIEZO2 siRNAs. b Current densities elicited by maximum displacement of siRNA-transfected iPSC-derived neurons. Bars are mean ± SD. Kruskal-Wallis (H = 13.9; p = 9.6−4) and Dunn’s multiple comparisons test. c Representative whole-cell patch-clamp recordings of currents elicited by mechanical stimulation (−60 mV) of control and LA-treated iPSC-derived sensory neurons (two-day LA supplementation; 50 µM for 24 h and 100 µM for another 24 h). d Current densities elicited by maximum displacement of control and LA-treated iPSC-derived neurons. Bars are mean ± SD. Two-tailed unpaired t-test (t = 4.57). e Boxplots show the displacement thresholds required to elicit mechanocurrents in of control and LA-treated iPSC-derived neurons. Two-tailed Mann-Whitney test (U = 9). f Top, current-clamp recordings of membrane potential changes elicited by indentation of control and LA-treated iPSC-derived neurons. Bottom, membrane potential peak vs. mechanical indentation of independent iPSC-derived neurons. At the top, boxplots show the displacement threshold required to elicit an action potential in these neurons. Two-tailed Mann-Whitney test (U = 0.5). g Representative whole-cell patch-clamp recordings elicited by mechanical stimulation (−60 mV) of rapidly, intermediate, and slowly inactivating currents of neurotypical and AS DPSC-derived neurons, with or without LA supplementation (two-day LA supplementation; 50 µM for 24 h and 100 µM for another 24 h). h Current densities elicited by maximum displacement from neurotypical and AS DPSC-derived neurons, ± LA supplementation, classified by their time constant of inactivation. Bars are mean ± SD. Two-way ANOVA (F = 45.23; p = 5.69−13) and Tukey multiple-comparisons test. Neurotypical (three individuals), AS (five individuals), and AS + LA (three individuals). Boxplots show mean (square), median (bisecting line), bounds of box (75th to 25th percentiles), outlier range with 1.5 coefficient (whiskers), and minimum and maximum data points. n is denoted in each panel. Post-hoc p-values are denoted in the corresponding panels. Source data are provided as a Source Data file.

