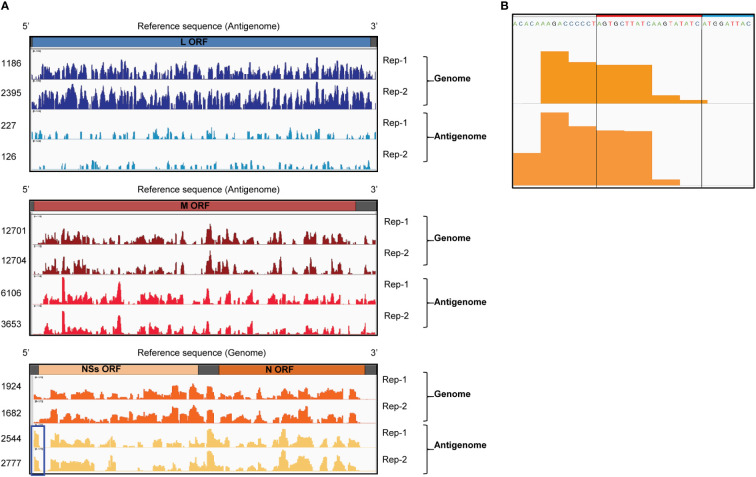
Figure 3.
CLIP-seq analysis of Gn-binding sites in RVFV RNA segments. (A) CLIP-seq read coverage plots of RVFV genomic and antigenomic RNA segments bound by Gn: L RNA (top plot), M RNA (middle plot), and S RNA (bottom plot). Read coverage plots of immunoprecipitated RNAs were generated after normalization with reads obtained from intracellular RNA (input control). Read coverages of each viral RNA are visualized by Integrative Genomics Viewer and read values are indicated on the left side of the coverage plots. Two independent biological replicates are plotted and designated by Rep-1 and Rep-2. Blue box indicates a prominent peak within the 3’ NCR of antigenomic S RNA. ORF = open reading frame (B) The sequence and CLIP-seq read coverage plots (orange-colored areas) of the 3’ NCR of the antigenomic S RNA (Rep-1 and Rep-2). The 19 nt region, which is deleted in RVFV Δ19, is indicated by a red box and a portion of the NSs ORF is shown by a blue box.

