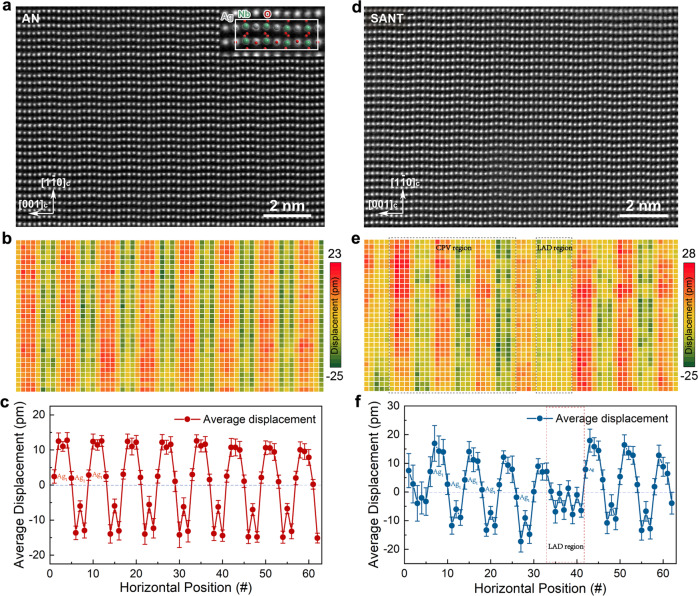
Fig. 2. Comparison of the atomic-scale structures of AN and SANT.
HAADF-STEM image of pure AN. Inset shows the local enlargement with the crystal structure overlaid (a). Map of the atomic displacements of Ag and Nb atoms along the direction, showing a good c-axial periodicity (b). Average displacement of each vertical atomic plane (c). HAADF-STEM image of SANT (d). Map of the atomic displacements of Ag, Nb, and Ta atoms along the [1-10]C direction (e). Both the periodicity and the displacement magnitude manifest large variations compared to that of the AN system. Two different kinds of cation displacement variation regions can be defined in the SANT system. One is the cation periodic variation (CPV) region, the other is the low-atom-displacements (LAD) region. Average displacement of each vertical atomic plane. Error bars are standard deviation (f).

