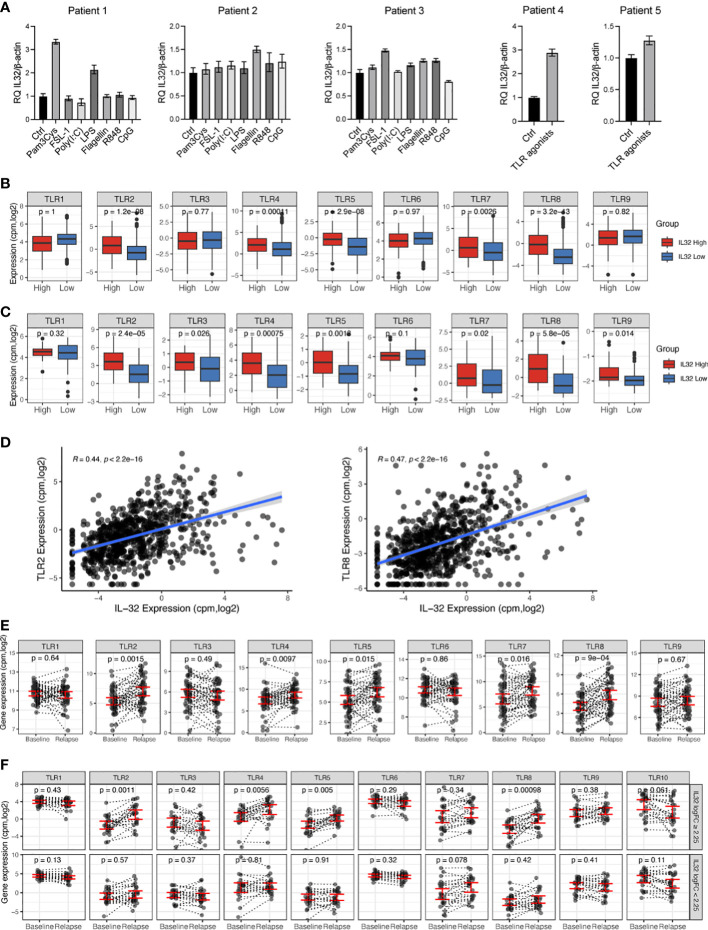
Figure 2.
IL-32 is associated with TLR expression in primary MM cells. (A) Freshly obtained primary CD138+ myeloma cells were stimulated with TLR agonists for 4 hours and IL-32 expression was evaluated by qPCR. The figure shows mean RQ ± SD of technical replicates. The Ct-values for IL-32 in untreated cells were for patient #1: 33.13, patient #2: 34.05, patient #3: 31.32, patient # 4: 31.92 and patient #5: 32.43. (B) TLR gene expression in IL-32 expressing patients (upper10th percentile) compared to non-expressing patients (lower 90th percentile) in CoMMpass IA13. (C) TLR gene expression in IL-32 expressing patients (upper 30th percentile) compared to non-expressing patients (lower 70th percentile) in our own (Biobank1) dataset. (D) Plot showing Pearson correlation between IL-32 and TLR2 and TLR8 in the CoMMpass IA13 dataset. (E) TLR expression at diagnosis and first relapse timepoint in RNA-sequenced longitudinal CD138+ patient samples from CoMMpass IA13. Figure shows the mean ± SEM for TLR expression at diagnosis and relapse. (F) TLR expression between diagnosis (baseline) and relapse for patients with an FC ≥ 2.25 increase of IL-32 in relapse (n=24) and patients with FC<2.25 increase of IL-32 in relapse (n=23). The figure shows the mean ± SEM for TLR expression at diagnosis and relapse in each group. In A, B and D, significance was analyzed by one-tailed Wilcoxon signed-rank test. In E significance was calculated by two-tailed Wilcoxon signed-rank test.

