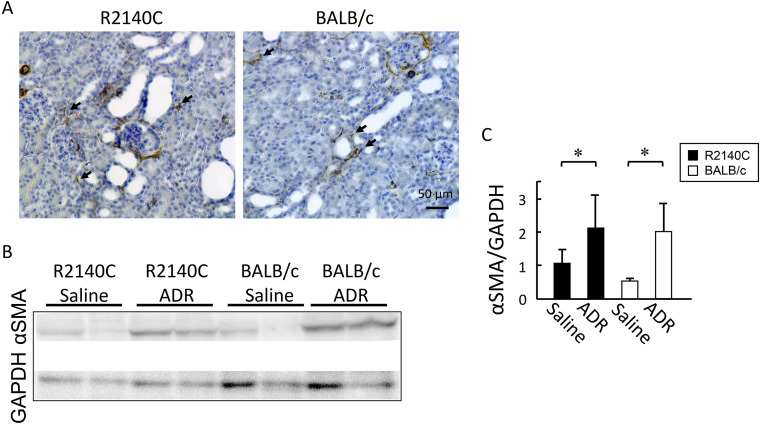
Fig. 3.
Expression of α-smooth muscle actin (SMA) protein. (A) Representative immunohistochemical staining of α-SMA in kidney tissue samples from adriamycin (ADR)-treated mice. α-SMA-positive interstitial cells (arrows). Scale bar, 50 µm. (B, C) Western blot analysis of α-SMA from ADR-treated BALB/c (n=5) and B6-PrkdcR2140C (n=5) mice, and non-treated BALB/c (n=4) and B6-PrkdcR2140C (n=4) mice were analyzed. Data are expressed as mean ± SD. *P<0.05.

