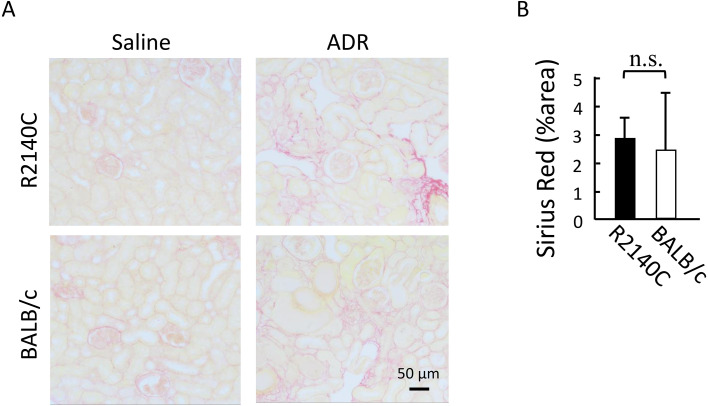
Fig. 4.
Evaluation of interstitial fibrosis with Sirius red staining. (A) Representative Picrosirius red-stained images of kidney sections from adriamycin (ADR)-treated mice. Scale bar, 50 µm. (B) Graph comparing the fibrosis area vs. total area. ADR-treated BALB/c (n=6) and B6-PrkdcR2140C (n=6) mice were analyzed. Data are expressed as mean ± SD. n.s: not significant.

