Figure 6.

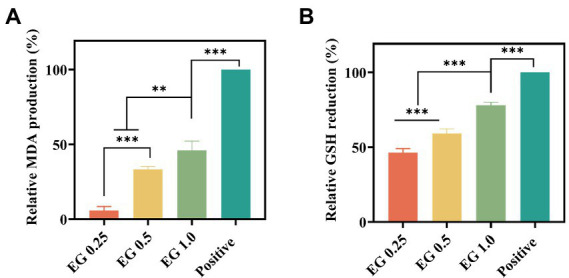
Effect of EG on the malondialdehyde (MDA) expression (A) and intracellular GSH expression (B) in the bacteria. **p < 0.01, ***p < 0.001.

Effect of EG on the malondialdehyde (MDA) expression (A) and intracellular GSH expression (B) in the bacteria. **p < 0.01, ***p < 0.001.