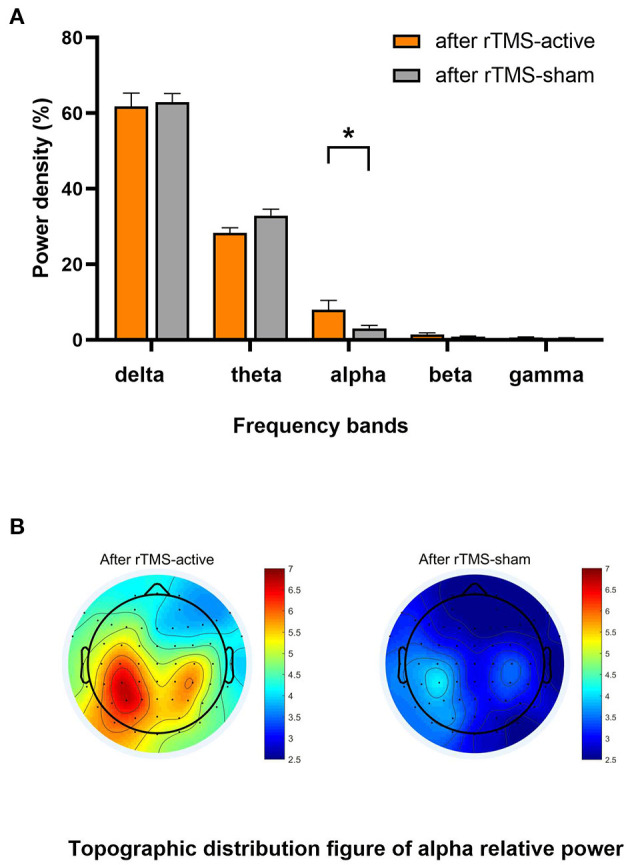
Figure 3.

Result of the general linear model ANOVA showed differences in EEG relative power between-group levels (after rTMS-active and after rTMS-sham). (A) The relative power in five frequency bands. A statistical significance was only found in the relative alpha power (*p < 0.01). The data were expressed as the means ± SEM. (B) There was a difference in whole-brain topographic distribution figure of relative alpha power. Left column: group of after rTMS-active; right column: a group of after rTMS-sham.
