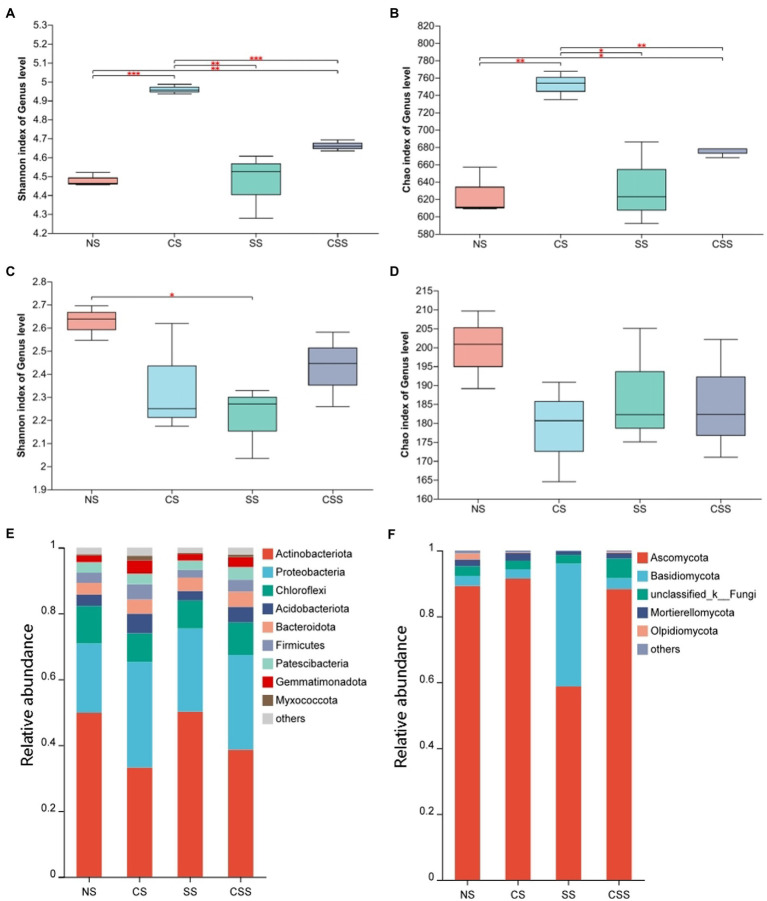
Figure 6.
The diversity and composition of peanut rhizosphere microbiome. (A) Boxplot of soil bacterial diversity based on Shannon indices on the genus level; (B) Boxplot of soil bacterial richness based on Chao1 indices on the genus level; (C) Boxplot of soil Fungal diversity based on Shannon indices on the genus level; (D) Boxplot of soil Fungal richness based on Chao1 indices on the genus level; Differences between the means in each group were compared using a Wilcoxon rank-sum test (*p < 0.05, **p < 0.01, and ***p < 0.001). The top and bottom whiskers indicate the maximum and minimum values, respectively, and the hyphen represents the median value; (E) Bacterial composition of soil samples at the phylum level. (F) Fungal composition of soil samples at the phylum level. NS, uninoculated soil; CS, Soil inoculated with Bacillus velezensis CB13; SS, Soil inoculated with Sclerotium rolfsii; CSS, Soil inoculated with B. velezensis CB13 and S. rolfsii.

