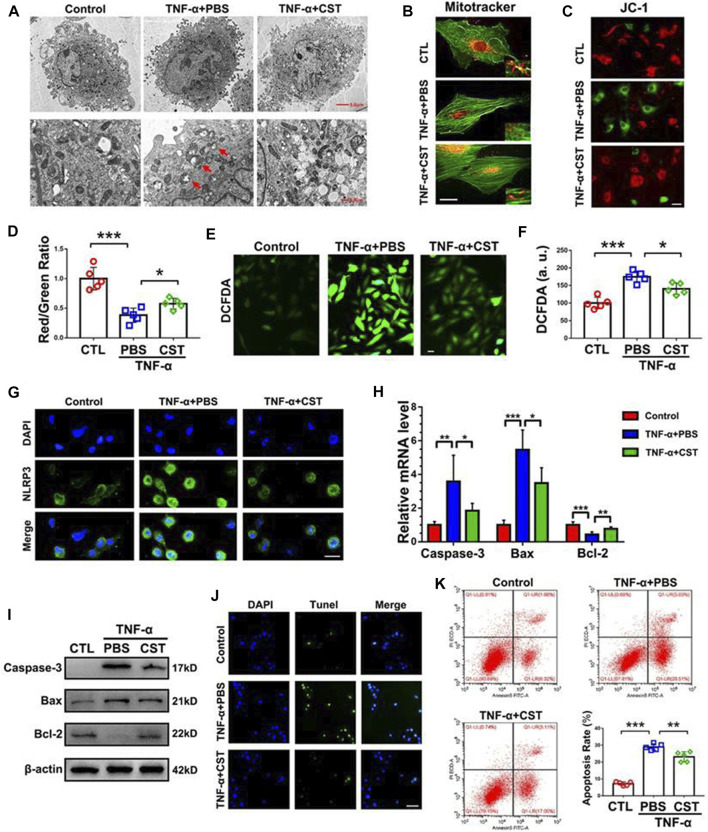
FIGURE 2.
Comparison of human NP cells between groups under transmission electron microscopy (A) MitoTracker staining for mitochondria and phalloidin for cytoskeleton (B), scale bar = 10 μm. Comparison of JC-1 assay images between different groups (C), scale bar = 20 μm. Quantitative comparison of red and green fluorescence in JC-1 assays (D). Images of iNOS as determined by DCFDA staining (E), scale bar = 20 μm. Quantitative analysis of iNOS content (F). Comparison of NLRP3 staining in different groups (G), scale bar = 20 μm. Comparison of the caspase-3, Bax, and Bcl-2 mRNA levels in different groups (H). Western blot analysis of caspase-3, Bax and Bcl-2 in different groups (I). Images of TUNEL staining in different groups (J), scale bar = 100 μm. Comparison of the results of the number of apoptotic NPs, as measured by flow cytometry (K). “*” p < 0.05, “**” p < 0.01 and “***” p < 0.001. CST corticostatin. Reproduced with permission from a previous publication (Zhao et al., 2020).

