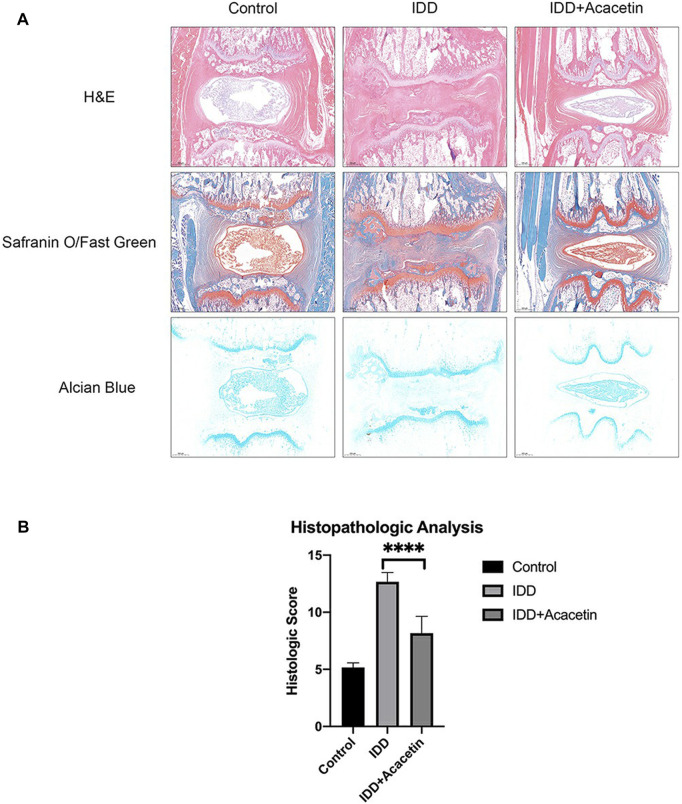
FIGURE 5.
Images of IVD from rats in each treatment group stained with Safranin O/Fast Green and Alcian Blue in each group (A) A comparison of histological scores in each group (B), “****” p < 0.0001. Reproduced with permission from a previous publication (Wang et al., 2020b).

