Figure 2.

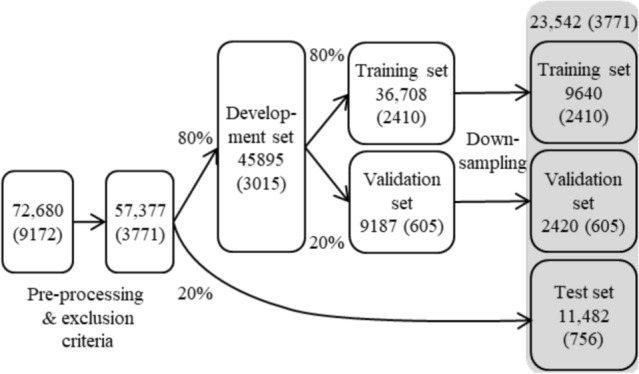
Patient flow diagram. The total number of patients is indicated for each step and the number of positive cases is denoted in brackets. The final data used in model evaluation comprised 23,542 patients and is depicted on a gray background.

Patient flow diagram. The total number of patients is indicated for each step and the number of positive cases is denoted in brackets. The final data used in model evaluation comprised 23,542 patients and is depicted on a gray background.