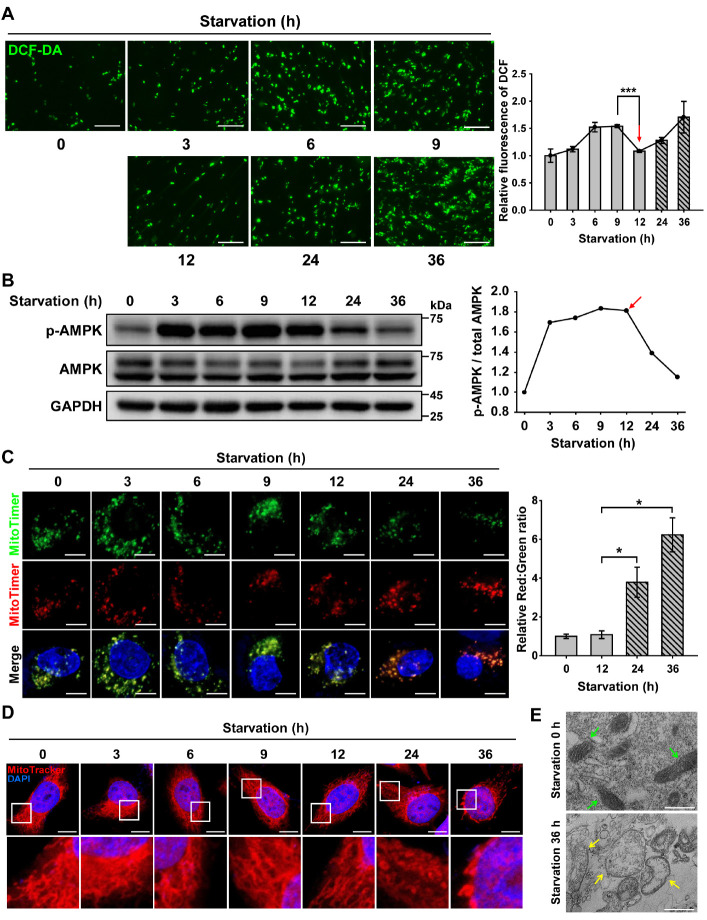
Fig. 1.
AMPK activation decreases the level of ROS produced by senescent mitochondria under nutrient starvation. ARPE-19 cells were starved with HBSS medium for 0-36 h. (A) Fluorescence microscopy images of DCF-DA-stained ARPE-19 cells under nutrient starvation for 0-36 h. Scale bar: 275 μm. Bar graph indicates the fluorescence intensity of DCF, which was normalized to starvation 0 h. The data are presented as the mean ± SEM, n = 3. ***P < 0.005. (B) Western blot analysis of AMPK and p-AMPK under nutrient starvation for 0-36 h. The graph indicates the ratio of p-AMPK to total AMPK. (C) Confocal fluorescence microscopy images of MitoTimer-expressing cells under nutrient starvation for 0-36 h. Scale bar: 10 μm. Bar graph represents the red-to-green fluorescence ratio of MitoTimer. Data are presented as the mean ± SEM, n = 3. *P < 0.05. (D) Confocal fluorescence microscopy images of MitoTracker Red-stained cells under nutrient starvation for 0-36 h. Nuclei were stained with DAPI (blue). Scale bar: 10 μm. (E) TEM images showing mitochondrial internal structures of ARPE-19 cells under nutrient starvation for 0 or 36 h. Green- and yellow-colored arrows indicate healthy and damaged mitochondria, respectively. Scale bar: 500 nm.

