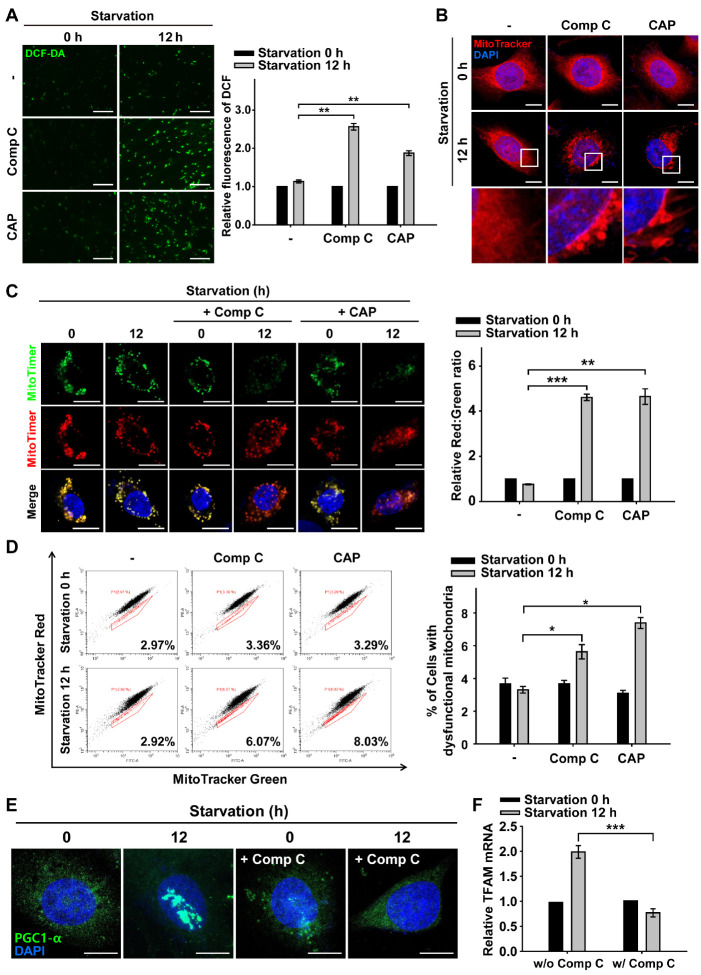
Fig. 2.
Inhibition of AMPK-dependent mitochondrial biogenesis increases ROS and mitochondrial senescence during nutrient starvation. ARPE-19 cells were starved with HBSS medium in the presence or absence of Comp C (5 μM) and CAP (50 μg/ml) for 12 h. (A) Fluorescence microscopy images of DCF-DA-stained ARPE-19 cells. Scale bar: 275 μm. Bar graph indicates the fluorescence intensity of DCF, which was normalized to starvation 0 h in the presence or absence of Comp and CAP. Data are presented as the mean ± SEM, n = 3. **P < 0.01. (B) MitoTracker Red-stained cells under nutrient starvation for 12 h in the presence or absence of Comp C and CAP. Nuclei were stained with DAPI (blue). Scale bar: 10 μm. (C) Images in MitoTimer-expressing cells under nutrient starvation for 12 h in the presence or absence of Comp C and CAP. Scale bar: 10 μm. Bar graph represents the red-to-green fluorescence ratio of MitoTimer. Data are presented as the mean ± SEM, n = 3. **P < 0.01 and ***P < 0.005. (D) Flow cytometric assay for percentage population of cells with dysfunctional mitochondria in the presence or absence of Comp C and CAP. Bar graphs indicate the percentage of cells with dysfunctional mitochondria. Data are presented as the mean ± SEM, n = 3. *P < 0.05. (E) PGC1-α-immunostained (green) ARPE-19 cells under nutrient starvation for 12 h in the presence or absence of Comp C. Nuclei were stained with DAPI (blue). Scale bar: 10 μm. (F) Quantitative real-time PCR of ARPE-19 cells under nutrient starvation for 12 h in the presence or absence of Comp C. Bar graph indicates the relative mRNA level of TFAM which was normalized to starvation 0 h in the presence or absence of Comp C. Data are presented as the mean ± SEM, n = 3. ***P < 0.005.

