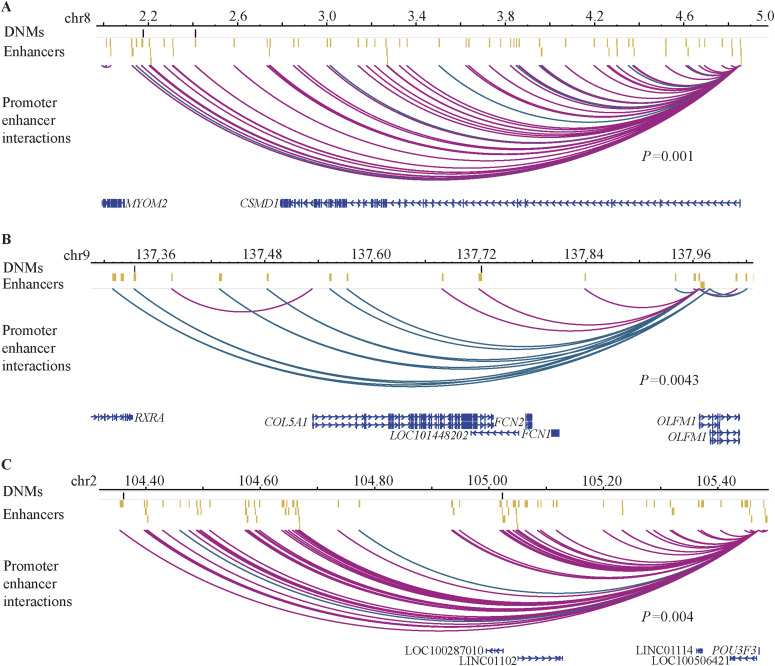
Figure 2. Enhancer clusters with recurrent DNMs in the ID cohort.
(A) Recurrent DNMs in the CSMD1 enhancer cluster. (B) Recurrent DNMs in the OLFM1 enhancer cluster. (C) Recurrent DNMs in the POU3F3 enhancer cluster. Black lines indicate DNMs, whereas yellow bars indicate enhancers. Magenta arcs represent fetal brain-specific enhancer–promoter interactions, whereas dark green arcs represent human gain enhancer–promoter interactions. The scales are provided as million base pairs.

