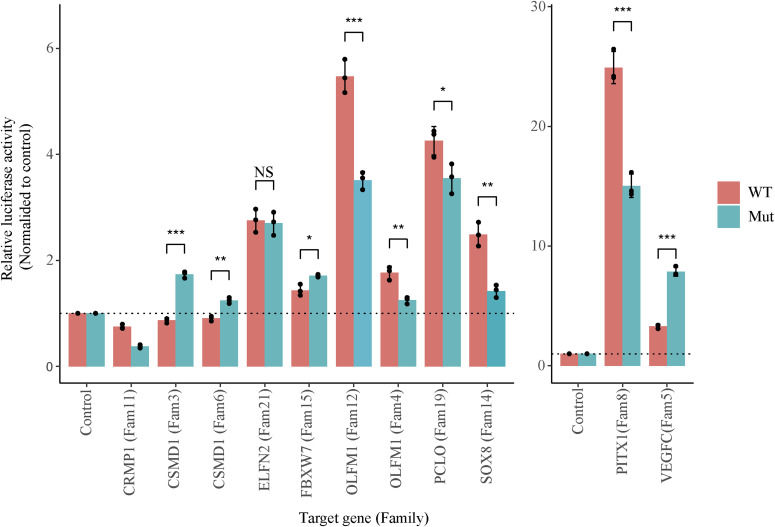
Figure 3. Effect of DNM on enhancer activity.
Dual-luciferase reporter assay of WT (reference) and the mutant (DNM) allele. The X-axis indicates the putative target genes of the enhancer, while the family IDs are shown in brackets. Y-axis indicates relative luciferase activity normalised to empty plasmid. The error bars indicate the SEM of three biological replicates. The enhancers associated with genes PITX1 and VEGFC are plotted separately with different Y-axis scales because of the high activity of these enhancers. The significance level was calculated using a two-tailed t test. *** indicates P-value ≤ 0.001, ** indicate P-value between 0.01 and 0.001, whereas * indicates P-value between 0.01 to 0.05.

