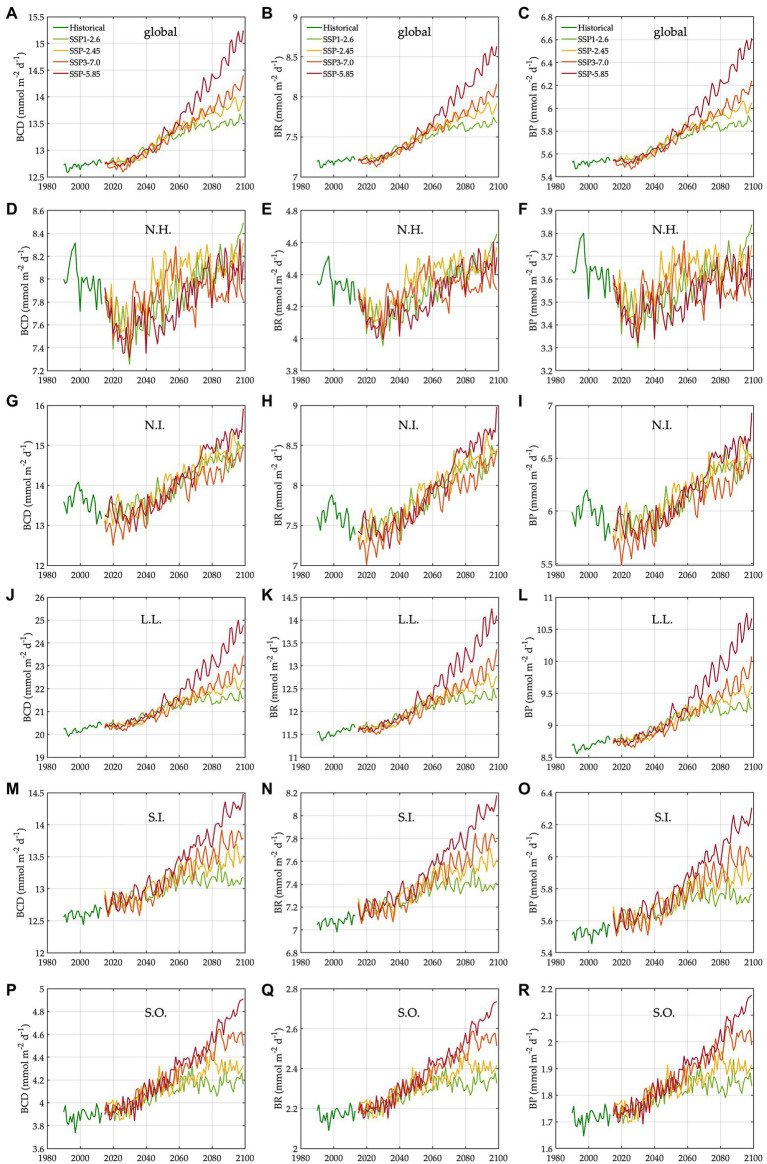
Figure 4.
Trends in bacterial carbon rates under different climate change scenarios. N.H.: northern high latitudes, N.I.: northern intermediates, L.L.: low latitudes, S.I.: southern intermediates, and S.O.: Southern Ocean. The trends (1990–2099) in bacterial carbon demand in the global ocean (A), N.H. (D), N.I. (G), L.L. (J), S.I. (M), and S.O. (P). The trends (1990–2099) in bacterial respiration in the global ocean (B), N.H. (E), N.I. (H), L.L. (K), S.I. (N), and S.O. (Q). The trends (1990–2099) in bacterial production in the global ocean (C), N.H. (F), N.I. (I), L.L. (L), S.I. (O), and S.O. (R).

