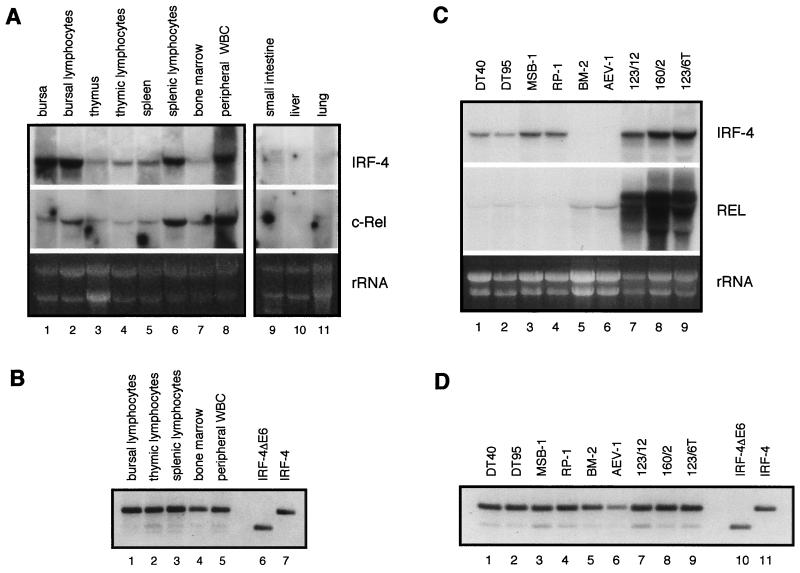
FIG. 4.
Expression patterns of chicken IRF-4, IRF-4ΔE6, and c-rel mRNA. Expression was analyzed by Northern blot analysis (panels A and C) and by RT-PCR (panels B and D). Total RNA (10 μg) was subjected to Northern blot analysis. The probes used to detect c-rel or v-rel and IRF-4 mRNA are described in Table 1. RT-PCR was performed on RNA samples used in Northern blot analysis. Forty PCR cycles were completed. (A) Expression of IRF-4 and c-rel mRNA in various tissues from a 1-month-old chicken. Peripheral white blood cells (WBC) and lymphocyte-enriched fractions from bursa, thymus, and spleen were obtained by Histopaque purification as described in Materials and Methods. The intensity of the rRNA stained with ethidium bromide is shown in the bottom panel (rRNA). (B) Expression of IRF-4 and IRF-4ΔE6 in bursal, splenic, and thymic lymphocytes, peripheral white blood cells, and bone marrow cells determined by RT-PCR. pREV-IRF-4ΔE6 and pREV-IRF-4 plasmids were PCR amplified with the same primers used for RT-PCR (lanes 6 and 7). (C) Expression of IRF-4 (upper panel), c-rel mRNA, and retrovirally expressed v-rel RNA (middle panel) in transformed cell lines as determined by Northern blotting. RNAs from B-cell lines DT40 and DT95, T-cell lines MSB-1 and RP-1, myeloblastoid cell line BM-2, erythroblastoid cell line AEV-1, v-rel-transformed B-cell line 123/12, T-cell line 160/2, and macrophage-like cell line 123/6T were analyzed. The intensity of the rRNA stained with ethidium bromide is shown in the bottom panel (rRNA). (D) Expression of IRF-4 and IRF-4ΔE6 in DT95, DT40, MSB-1, RP-1, BM-2, AEV-1, 123/12, 160/2, and 123/6T cell lines determined by RT-PCR. pREV-IRF-4ΔE6 and pREV-IRF-4 plasmids were PCR amplified with the same primers as used for RT-PCR (lanes 10 and 11).

