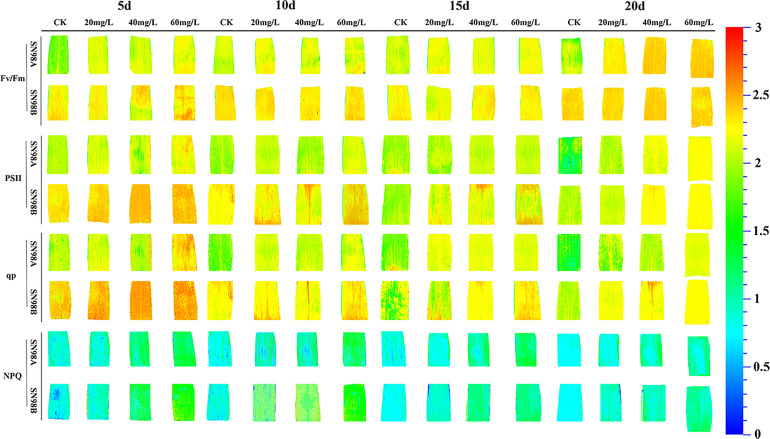
Figure 3.
Effects of GA3 application on chlorophyll fluorescence according to in situ imaging of inbred maize lines with differences in light sensitivity under low light stress conditions. In the figure panels, 5d, 10d, 15d, and 20d denote the number of days under shading treatment; 20, 40, and 60mg L–1 denote the GA3 concentrations applied; and CK denotes the water control treatment.

