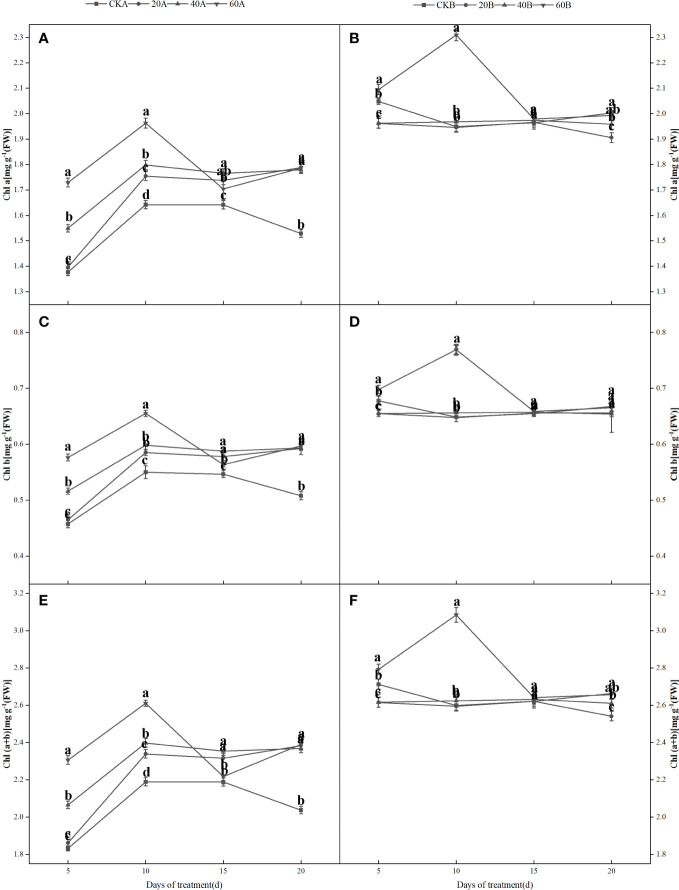
Figure 4.
Effects of GA3 application on the Chl a (A, B), Chl b (C, D), and Chl a+b (E, F) contents of different light-sensitive inbred maize lines under low light stress. Values are expressed as mean ± SD of three replicates. Lower-case letters indicate the mean difference of different treatments in the same period, which is statistically significant (P<0.05).

