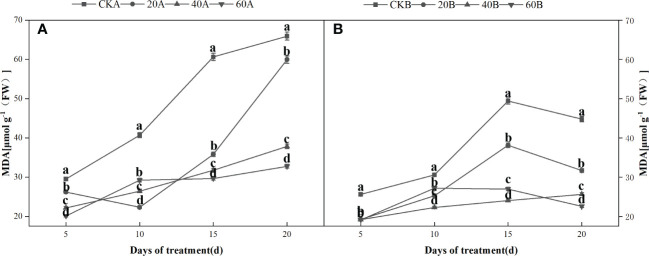
Figure 6.
Effects of GA3 on MDA content of light-sensitive maize inbred lines at different periods under low light stress. In the figure panels, 20A, 40A, and 60A denote SN98A sprayed with 20 mg L–1, 40 mg L–1, and 60 mg L–1 GA3, respectively, and 20B, 40B, and 60B denote SN98B sprayed with 20 mg L–1, 40 mg L–1, and 60 mg L–1 GA3. CKA denotes the SN98A control group sprayed with water and CKB denotes the SN98B control group sprayed with water. In the figure, (A) is the change of MDA in SN98A after GA3 treatment, and (B) is the change of MDA in SN98B after GA3 treatment. Values are expressed as mean ± SD of three replicates. Lower-case letters indicate the mean difference of different treatments in the same period, which is statistically significant (P<0.05).

