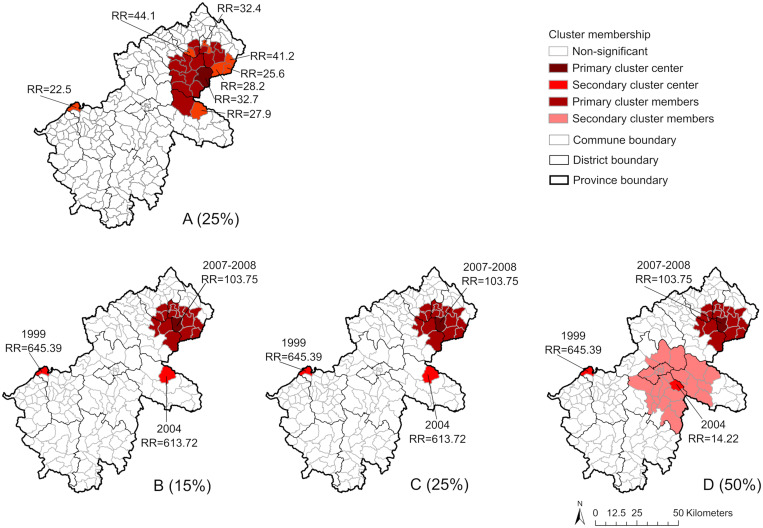
Figure 7.
(A) Spatial-only clusters (25%; results at 15% and 50% were similar to those at 25%). (B–D) Space-time clusters (B, 15%; C, 25%; D, 50%) of human anthrax identified by SaTScan Statistics (Poisson model, 999 permutations, 15%, 25%, 50% of population at risk). The RR indicates the risk of having human anthrax reported for the commune inside of the clusters compared with outside of the clusters.

