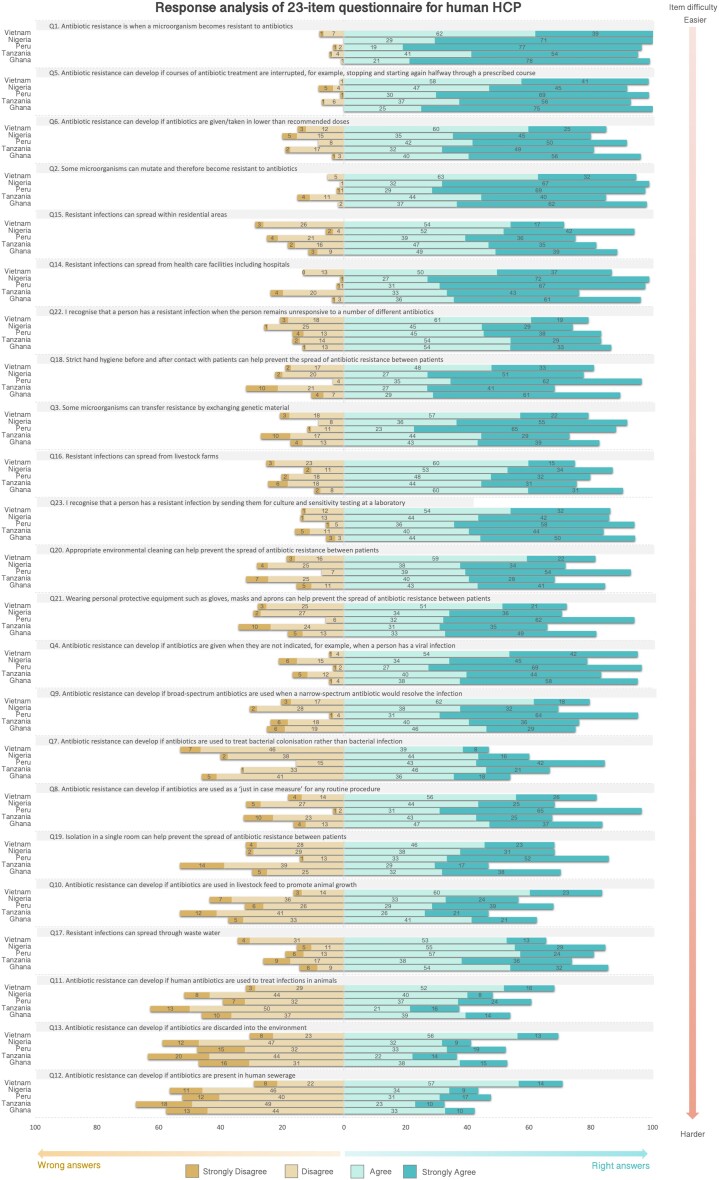
Figure 5.
Response analysis of ABR awareness module used to calculate scores (23-item) for HHCPs. Items are ordered by level of difficulty, from easier to harder (vertical arrow on the right). Every bar in the graph represents the percentages of participant responses to every item in the Likert scale. To the right, there are the percentages of participants that ‘strongly agree’ or ‘agree’ with the items, and to the left, the percentages of participants that ‘strongly disagree’ and ‘disagree’ with the items. S1A (Mechanisms of ABR), S1B (ABU as a driver of ABR), S1C (Transmission and control of ABR infections) and S1D (Detecting/recognizing ABR) are the codes of the location of the items in the conceptual framework. This figure appears in colour in the online version of JAC and in black and white in the print version of JAC.

