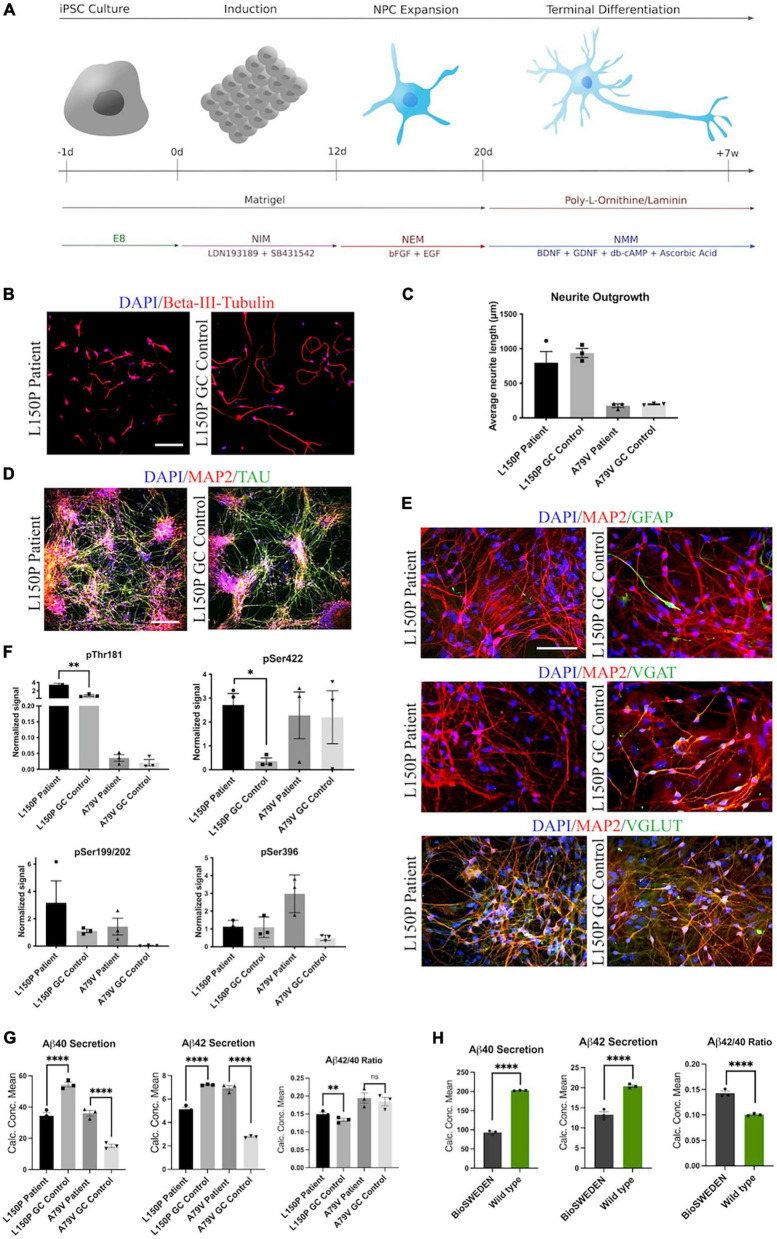
FIGURE 1.
Generation and characterization of hiPSC derived neurons. (A) Schematic overview of the neural differentiation protocol. (B) Neurite outgrowth analysis via ICC expression of Beta-III-tubulin. Scale bar 100 μm. (C) Quantitative assessment of average neurite outgrowth. (D) Representative ICC images of neuronal markers MAP2 and TAU. Scale bar 100 μm. (E) Representative ICC images of MAP2, astrocytic marker GFAP, GABAergic neuron marker VGAT, and glutamatergic neuron marker VGLUT. Scale bar 50 μm. (F) Quantitative assessment of Tau phosphorylation (all four isoforms) - pThr181, pSer422, pSer199/202, and pSer396. (G) Quantitative assessment of Aβ40 and 42 secretion, and Aβ42/40 ratio in L150P and A79V hiPSC derived neurons. (H) Quantitative assessment Aβ40 and 42 secretion, and Aβ42/40 ratio in K3P53 and BioSweden hiPSC derived neurons. Results are displayed as mean ± standard error of the mean (SEM) from three replicates. Significance levels are indicated by *p < 0.05, **p < 0.01, and ****p < 0.0001.

