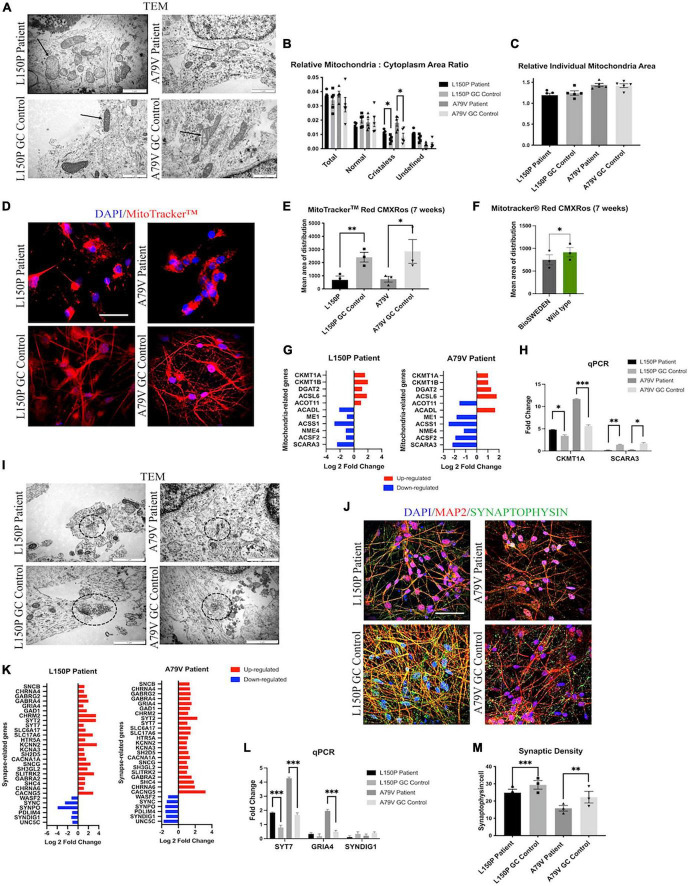
FIGURE 2.
fAD neurons display mitochondria and synaptic deficits. (A) TEM evaluation of mitochondria (indicated by arrows) ultrastructure. Scale bar 1 μm. (B) Quantitative TEM morphometry assessment of relative mitochondria to cytoplasm ratio. (C) Quantitative TEM morphometry evaluation of relative individual mitochondria area. (D) Representative ICC images of MitoTracker™ analysis. Scale bar 50 μm. (E) Quantitative assessment of MitoTracker™ analysis showing mean area of distribution in L150P and A79V hiPSC derived neurons. (F) Quantitative assessment of MitoTracker™ analysis showing mean area of distribution in K3P53 and BioSweden hiPSC derived neurons. (G) Overview of top significantly differentially expressed genes associated with mitochondria. (H) qPCR validation of key differentially expressed genes associated with mitochondria identified by RNA-seq analysis. (I) TEM evaluation of synapses and synaptic vesicles (circled). Scale bar 1 μm. (J) Representative ICC images of synaptophysin expression. Scale bar 50 μM. (K) Overview of top significantly differentially expressed genes associated with synapses. Adjusted p-value is displayed in Supplementary Table 2C. (L) qPCR validation of key differentially expressed genes associated with synapses identified by RNA-seq analysis. (M) Quantitative assessment of synaptophysin expression. Results are displayed as mean ± standard error of the mean (SEM) from three replicates. Significance levels are indicated by *p < 0.05, **p < 0.01, ***p < 0.001.

