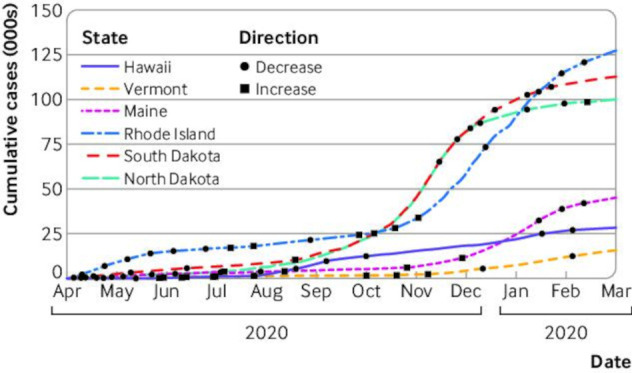
Figure 2.

Cumulative covid-19 cases and the breakpoints identified for US states with three lowest and highest covid-19 cases per capita, as of 7 March 2021. Breakpoints, dates when linear segments of covid-19 case velocities showed substantial change in rate, were plotted over the linear plot of cases for each respective US state
