
FIGURE 7.
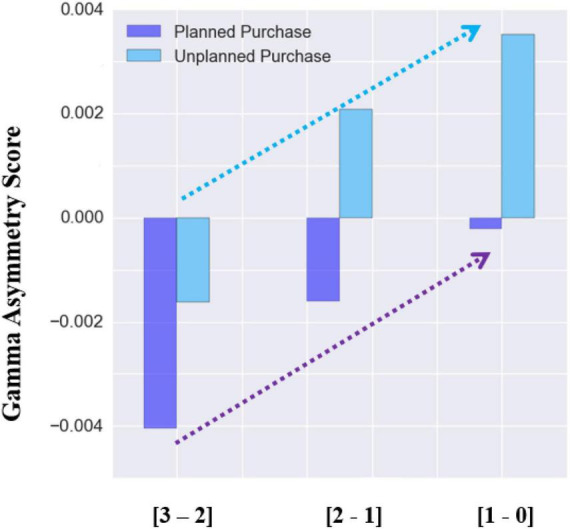
Gamma asymmetry score (averaged for all subject over all purchased items) for the three 1-s epochs before choosing a product. The horizontal axis shows the three time-intervals (within the 3 s window) before choosing a product.
Official websites use .gov
A
.gov website belongs to an official
government organization in the United States.
Secure .gov websites use HTTPS
A lock (
) or https:// means you've safely
connected to the .gov website. Share sensitive
information only on official, secure websites.
Gamma asymmetry score (averaged for all subject over all purchased items) for the three 1-s epochs before choosing a product. The horizontal axis shows the three time-intervals (within the 3 s window) before choosing a product.