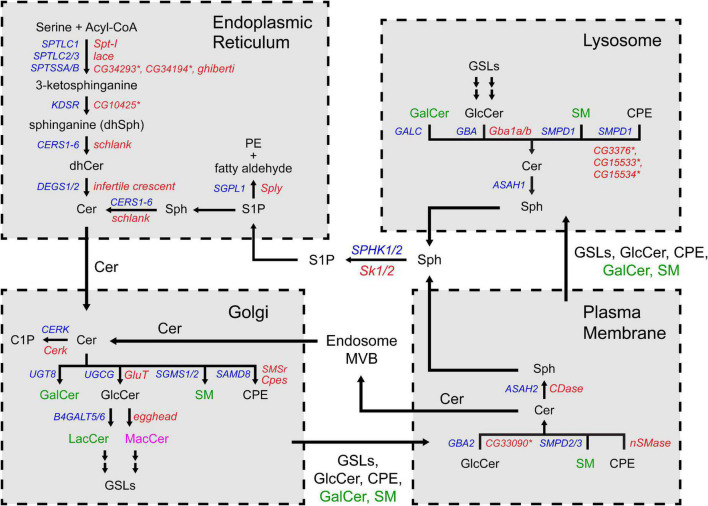
FIGURE 2.
The sphingolipid metabolism network. The biochemical reactions are grouped by the organelles in which they occur. The substrates and products are indicated in three colors depending on their presence in human and flies: black (both human and fly), green (human) and magenta (fly). The genes encoding the enzymes are also indicated in colors: blue (human) and red (fly). Asterisks indicate predicted orthologs in flies. Cer, ceramide; dhCer, dihydroceramide; C1P, ceramide-1-phosphate; GalCer, galactosylceramide; GlcCer, glucosylceramide; LacCer, lactosylceramide; MacCer, mannosyl glucosylceramide; PE, phosphoethanolamine; CPE, ceramide phosphoethanolamine; SM, sphingomyelin; Sph, sphingosine; dhSph, dihydrosphingosine; S1P, sphingosine-1-phosphate; GSL, glycosphingolipid.

