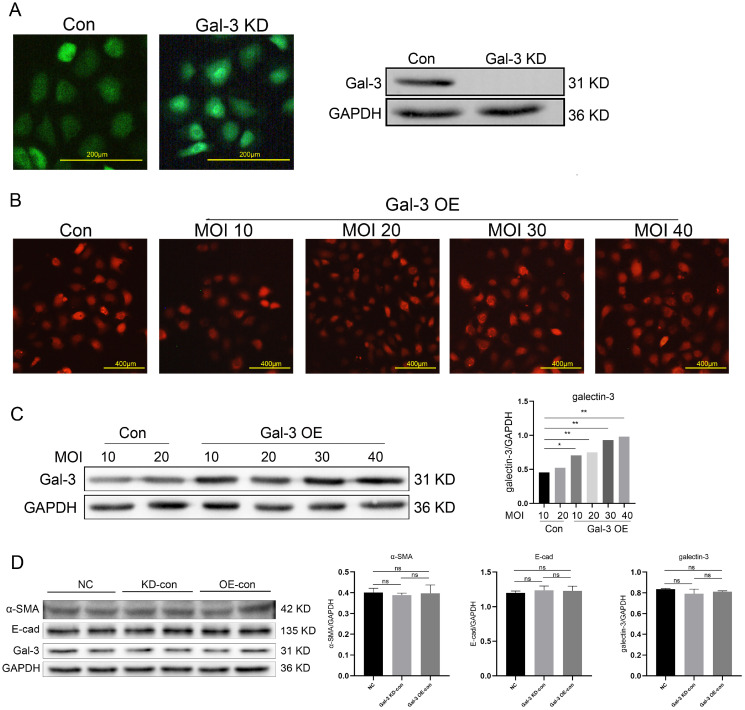
Fig. 5.
The expression of Gal-3 in NRK-52E cells was detected by fluorescence microscope and western blot. Results were normalized relative to the expression of GAPDH. Results were normalized relative to the expression of GAPDH. N=3 (per group). Data are presented as mean±SD and analyzed by two-way ANOVA followed by Tukey post hoc testing. *p<0.05, **p<0.001 vs. control group. Scale bar (A)=200 μm, (B)=400 μm.

