. 2023 Jan 9;83(5):771–785. doi: 10.1158/0008-5472.CAN-22-1570

Figure 3.

Figure 3. Validation of double-positive TAMs. A–B, Uniform Manifold Approximation and Projection (UMAP) plot displaying the expression of TAMs (A) and tumor (B) signature score, colored by the normalized signature score level. C, UMAP plot displaying the distribution of double-positive TAMs, colored by cell types. D–E, UMAP plot displaying the expression of canonical MG (D) and BMDMs (E) markers, colored by the expression levels of indicated genes. F, UMAP plot displaying the expression levels of M2 macrophage markers, colored by the expression level of indicated genes.

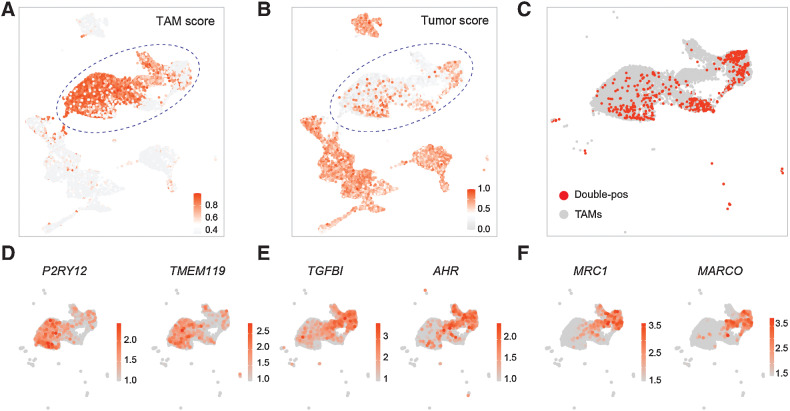
Validation of double-positive TAMs. A and B, Uniform Manifold Approximation and Projection (UMAP) plot displaying the expression of TAMs (A) and tumor (B) signature score, colored by the normalized signature score level. C, UMAP plot displaying the distribution of double-positive (double-pos) TAMs, colored by cell types. D and E, UMAP plot displaying the expression of canonical MG (D) and BMDMs (E) markers, colored by the expression levels of indicated genes. F, UMAP plot displaying the expression levels of M2 macrophage markers, colored by the expression level of indicated genes.