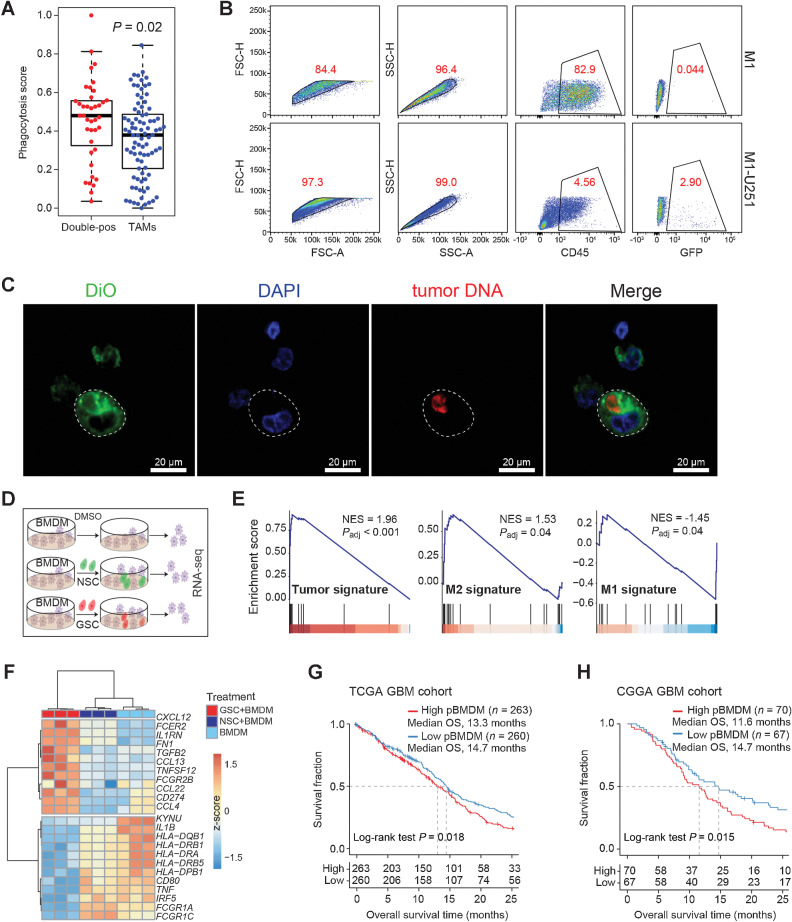
Figure 4.
Formation of the double-positive TAMs in an in vitro coculture system. A, Box plot showing the phagocytosis score of double-positive TAMs (n = 39) and other TAMs (n = 86). P values are calculated by the two-sided Wilcoxon rank-sum test. B, Flow cytometry analysis showing the GFP fluorescence in THP1-derived M1 macrophages cultured alone or cocultured with GFP+ U251 cells. C, Representative fluorescence images of M1 macrophages. Tumor DNA in U251 was prelabeled by PI, and the plasma membrane of M1 macrophages was labeled with 3,3′-dioctadecyloxacarbocyanine perchlorate (DiO). Subsequently, the U251 cells were cocultured with M1 macrophages for 2 hours, and then DNA of M1 macrophages was labeled by 4′,6-diamidino-2-phenylindole (DAPI). Scale bars, 20 μm. D, Schematic workflow for the RNA-seq of BMDMs. BMDMs were cocultured with DMSO (top), NSCs (middle), or GSCs (bottom) for 24 hours, and total RNA was extracted for sequencing. E, GSEA plots of BMDMs cocultured with GSCs compared with BMDMs cocultured with NSCs. GSEA was performed by R package clusterProfiler. F, Heat map depicting the differentially expressed genes following different treatments. G and H, Kaplan–Meier survival curves show the OS of GBM patients in the TCGA (G) and CGGA cohorts (H). Patients are classified into two groups based on the median NES of the pBMDMs signature. P values were calculated by the log-rank test.

